Are semiconductor stocks a good investment after a selloff? A drop in a semiconductor ETF says the theme reset. You still have to settle SMH or SOXX, the fund or the chip stocks, and whether the businesses weakened with the price.
Buydy has a built-in Semiconductors view in three tools:
- ETF screener: which semiconductor funds sit closest to their 1-year low?
- ETF Heatmap: which of those funds rank stronger on size, fees, and distance from the low?
- Stock heat map: which large-cap designers, foundries, and equipment makers reset and still rank well on leverage and cash flow?
The screener finds the price losers. The heat maps rank them. A rank is a research lead.
What investors ask first about semiconductor stocks
One semiconductor label covers four businesses. Designers sell the chip design, including Nvidia, Broadcom, and AMD. Foundries manufacture the chips, including TSMC. Equipment makers sell the tools those factories buy, including ASML, Applied Materials, and Lam Research. Memory makers sell a product customers can often swap. They share a cycle and keep different balance sheets. The names are examples, so you know which industry row to open.
Should you buy the dip? Name which of these you are looking at.
| What you see |
Read it as |
Next check |
| Fund near its low, companies mixed |
The theme reset |
Fee and size in the ETF Heatmap |
| Fund near its low, one holding dominates |
Concentration |
That company on the stock heat map |
| Fund near its low, leverage up, cash flow weak |
The business may be the cause |
Filings |
| Fund far above its low, operating ranks strong |
A price winner that already re-rated |
A different question than "what is cheap" |
Semiconductor stocks move together because a small set of customers, mostly the companies building AI data centers, drives a large share of incremental demand. A spending plan, an export rule, or a Taiwan headline can move every semiconductor ETF on the same day. The fund screen records that shared move. The company screen is where the four businesses split apart.
Read the stock heat map before you choose a wrapper. When the leaders still look sound, a large low-cost fund is the simpler holding. When a few companies explain the drop, the fund averages them away. Two semiconductor ETFs often share the same top holdings, so read both factsheets before you own both.
SMH, SOXX, and other semiconductor ETFs
SMH and SOXX rhyme. The weights differ, and the better ticker is the one whose weights match the bet you want.
- SMH (VanEck) is a market-cap weighted basket of the largest US-listed semiconductor companies. The biggest designers, plus foundry and equipment names such as TSMC and ASML, can dominate it.
- SOXX (iShares) tracks a semiconductor index that caps any one company. You still own the leaders, with a smaller single-name weight.
- XSD (SPDR) is equal weight. A smaller chip company counts about as much as Nvidia.
- SOXQ (Invesco) is another large-cap semiconductor index fund. Compare its fee with SMH and SOXX in the heatmap, because fees change.
In the screener, read 1Y min gap, 1Y change, and fund P/E. In the heatmap, read assets and expense ratio as ranks against other semiconductor funds. A high expense rank means cheaper than those peers. When the holdings match, size and fee are the difference that matters. When the 1Y gaps diverge, the holdings differ. A leveraged fund such as SOXL stays off these views on purpose.
The semiconductor research workflow
| Step |
Tool |
You get |
| 1 |
ETF screener, Semiconductors |
Chip funds sorted from nearest the 1Y low |
| 2 |
ETF Heatmap, Semiconductors |
Fund ranks (Pxx) on AUM, 1Y gap, fees, and yield |
| 3 |
Stock heat map, Semiconductors |
Company ranks on price reset, valuation, leverage, and cash flow |
A loser sits near its 1-year low. A price winner sits far above that low, often with a positive 1-year change. A business winner ranks strongly on cash flow, leverage, or earnings growth. Those winners are often different companies.
Step 1: Screen chip ETFs in the ETF screener
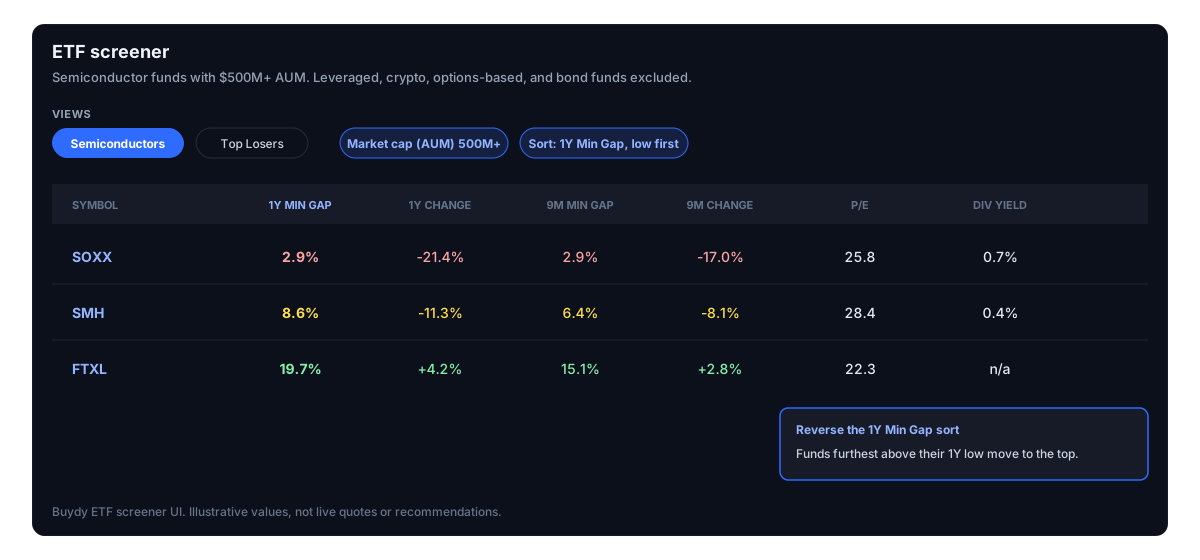
Open the ETF screener and select Semiconductors.
The view keeps semiconductor-labeled funds with at least $500M in AUM. It removes leveraged, crypto, bitcoin, options-based, and bond funds.
Columns: 1Y min gap, 1Y change, 9M min gap, 9M change, P/E, and dividend yield.
The first sort is 1Y min gap ascending, so funds closest to their 1-year low appear first. Reverse that sort for the price winners, and read 1Y change beside the gap. A large gap from the low with a positive 1Y change is a recovery.
Advantages
- Fastest view of which chip funds reset over the year.
- The AUM floor and exclusions keep tiny and leveraged funds out.
- The 9M and 1Y windows show whether the drop is new or has lasted.
Disadvantages
- The top row is the fund closest to its low, which is a location on the list.
- Fund P/E and yield are portfolio averages. One holding can pull P/E down, and a low P/E near a profit peak can be the expensive point in the cycle.
- Fees and holdings overlap are absent. Two chip funds can own the same companies.
Output: three to six semiconductor funds, each marked as a price loser or a recovery.
Step 2: Rank chip ETFs in the ETF Heatmap
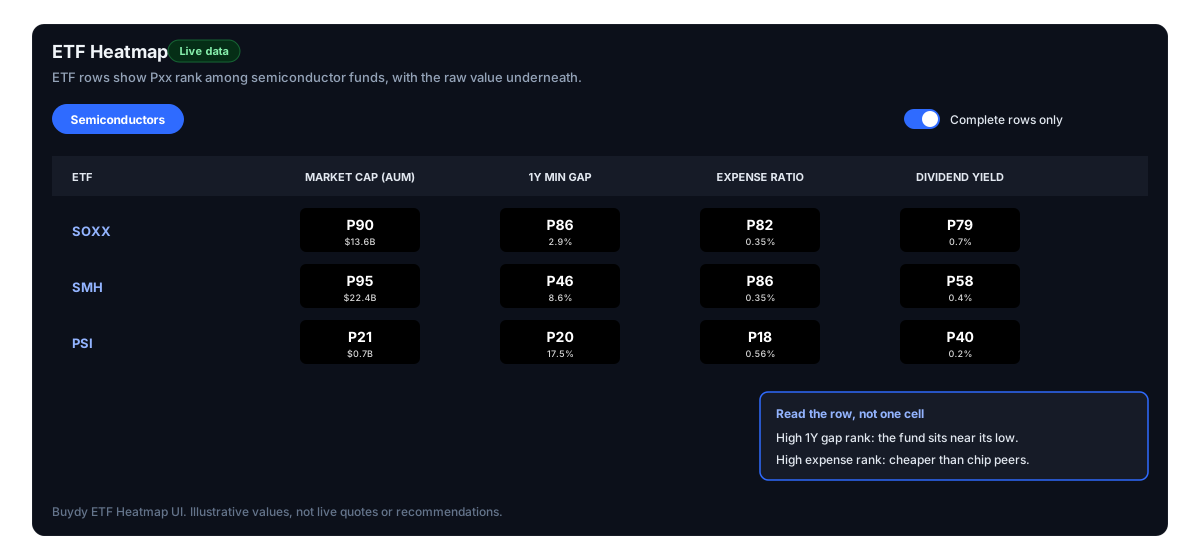
Open the ETF Heatmap and select Semiconductors.
The view keeps semiconductor-labeled funds and removes leveraged funds plus government, emerging-market, and global bond sleeves. It has no $500M floor, so screen for size first, then rank that shortlist here.
Columns: market cap (AUM), 1Y min gap, expense ratio, and dividend yield. Each cell is Pxx, the rank among semiconductor funds in the view, with the raw value underneath. Funds missing a visible rank are hidden.
1Y min gap and expense ratio are ranked so lower raw values score higher. A high 1Y gap Pxx means the fund sits nearer its 1-year low. A high expense Pxx means it is cheaper than its chip peers. The default order puts funds nearest the low first.
- Strong AUM and strong expense: a large, low-cost way to hold the theme.
- Strong 1Y gap and weak expense: near its low, and still expensive versus chip peers.
- A blank cell: missing data. Record it as missing.
Advantages
- Fees and size are ranked against other chip funds, with the raw number under each Pxx.
- Cost sits beside the reset, so the cheaper fund with the same holdings is easy to see.
Disadvantages
- Yield is a weak reason to own most semiconductor funds.
- A small fund with complete data can sit in the same rank set as SMH.
- Holdings stay on the factsheet. Turn complete rows only off if a fund you want is hidden.
Read how to use an ETF heat map and how to compare ETFs for the percentile habits.
Output: one or two funds, and the reason each ranks well or badly against chip peers.
Step 3: Rank chip companies in the stock heat map
Open the stock heat map and select Semiconductors. How to use a stock heat map covers the controls.
The view includes large-cap companies in semiconductors, semiconductor equipment and materials, and semiconductors and semiconductor equipment. It groups by industry and ranks each company against the other names in this view.
Columns start with 1Y min gap, 6M min gap, DCF upside, and P/E change over 1, 3, and 6 months. Then net debt to EBITDA, EBITDA and its growth, ROE, capex to sales, FCF yield, and FCF margin.
The default order is the biggest 1-year losers, then higher DCF upside, then the largest drops in P/E. All metrics only is on, so one missing metric hides the company. Turn complete rows only off before you treat a missing household name as absent from the industry.
Min gap, P/E change, and leverage score higher when the raw value is lower. A high 1Y gap Pxx means the stock sits nearer its low. A high net debt to EBITDA Pxx means lower leverage.
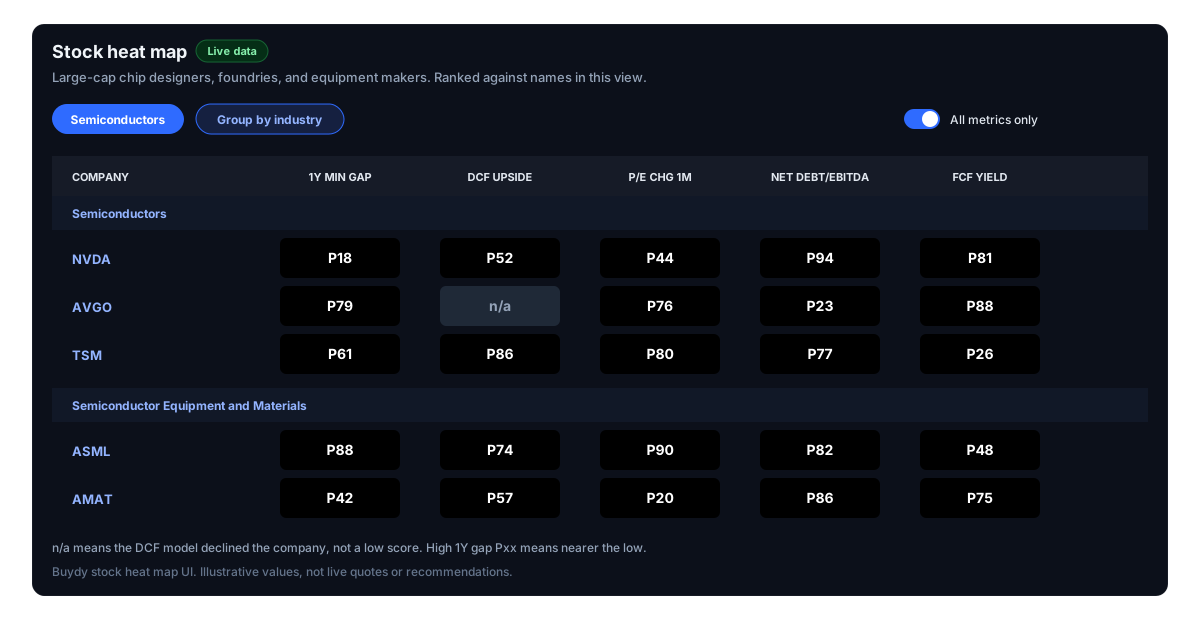
Compare inside the industry row:
- Price reset, strong FCF yield, low leverage: the business may be holding up.
- Price reset, rising leverage, falling EBITDA: the business may be why the stock fell.
- Large P/E drop, weak DCF upside: the multiple fell, and the cash flow model shows little room above the price.
Sort by EBITDA growth or FCF margin for business winners. Strong operating ranks with a weak price-reset rank usually mean the stock already re-rated.
Advantages
- You see the companies inside the fund.
- Price reset, leverage, earnings, and cash flow share one row.
- Equipment makers sit on their own industry rows.
Disadvantages
- DCF upside is missing when free cash flow history fails the model rules. That cell stays missing, and complete rows only hides the company until you turn the filter off.
- A low P/E near a profit peak can be a trap.
- Foundries and designers look different on capex and free cash flow. Read the business with the rank.
Output: two or three companies for the filings, and the metric that made each one interesting.
Which semiconductor view to use
| Question |
Best tool |
Main limit |
| Which chip funds are nearest their 1Y low? |
ETF screener |
A sort, with no peer rank |
| SMH, SOXX, XSD, or SOXQ? |
Screener, then ETF Heatmap |
Holdings can still match |
| Which fund is cheaper or larger than chip peers? |
ETF Heatmap |
Small funds can enter the ranks |
| Which companies reset and still produce cash? |
Stock heat map |
Cyclical earnings and missing DCF |
| Why is a known chip stock missing? |
Turn complete rows only off |
A blank is missing data |
| Do two funds own the same companies? |
Factsheets, then the stock heat map |
The overlap is outside the heatmap |
Mistakes to avoid
- Buying the top row of a loser sort. That row is a location. The ranks and the filings are the judgment.
- Treating SMH and SOXX as one fund. Matching holdings means you are choosing a fee and a weight cap.
- Calling a low fund P/E cheap. It is a weighted average, and chip profits peak when the cycle is fullest.
- Reading a Pxx as a rank against the whole market. Inside this view it is a semiconductor peer rank.
- Reading a blank as a weak score. Missing data stays missing.
- Using one window. Check 9M beside 1Y on funds, and 6M beside 1Y on stocks.
FAQ
Are semiconductor stocks a good investment?
A selloff starts the question. The three Semiconductors views show which funds reset, which of those funds are large and cheap versus other chip funds, and which companies still rank well on cash flow and leverage. The decision stays yours.
What is the best semiconductor ETF?
Match the weight to the question. SMH concentrates in the largest names. SOXX caps a single company. XSD weights names about equally. Compare assets, fees, and the 1-year gap in the ETF Heatmap, then read the holdings.
What is the difference between SMH and SOXX?
Both hold large semiconductor companies. SMH lets the biggest positions stay large, including TSMC and ASML when the index holds them. SOXX limits one company's weight. Matching holdings means the choice is the fee and the cap.
Should I buy a semiconductor ETF or individual chip stocks?
Read the stock heat map first. A large low-cost fund is the simpler way to own a group that still looks sound. Individual stocks fit when a few companies explain the drop and you have read their filings.
Why are semiconductor stocks so volatile?
Orders swing with the cycle, and a large share of recent demand comes from a few AI data-center customers. One spending, export, or earnings headline can move the whole label. The four businesses still diverge once you rank them by industry.
Are semiconductor stocks cyclical?
Yes. Profits move with orders for chips, factory tools, and memory. Pair any low P/E with free cash flow, leverage, and both price windows.
How do I find semiconductor winners and losers?
Sort the ETF screener by 1Y min gap ascending for funds near the low, and reverse it for funds far above the low. The stock heat map opens on the biggest 1-year losers. Sort by EBITDA growth or FCF margin for operating strength.
Why is SOXL missing from the semiconductor ETF list?
These views remove leveraged funds. A 3x product amplifies the daily move, so it stays off the SMH and SOXX comparison.
Why are some semiconductor funds or stocks missing?
The screener requires at least $500 million in assets. The heat maps hide a row that lacks a visible metric, and a missing DCF upside is a common reason a large company disappears. Turn complete rows only off. A blank cell is missing data.
Is this investment advice?
No. Read each fund's holdings and each company's filings before you decide.
Run it in Buydy
- ETF screener, Semiconductors: funds near the 1Y low, then reverse the sort for price winners.
- ETF Heatmap, Semiconductors: rank SMH, SOXX, and the other chip funds on assets, fees, and the 1Y gap.
- Stock heat map, Semiconductors: rank the companies on reset, leverage, and cash flow. Turn complete rows only off if a known name is hidden.
Buydy is free. See pricing, then register with an email and password if you want saved views. No credit card.
Research summaries. The shortlist still needs the filings.


