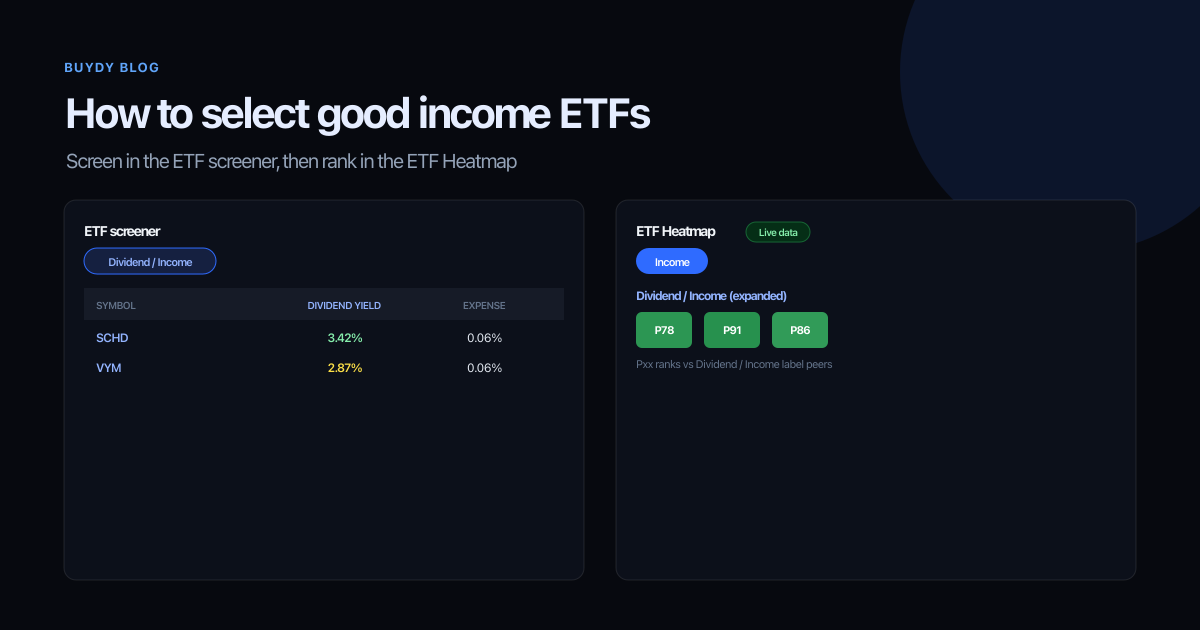
How do you select good income ETFs? Name the job first. Dividend equity, bonds, REITs, and covered-call funds all pay income, but they are not the same product. Sorting a giant table by yield and stopping at the top row is how investors pick the wrong fund.
Use two Buydy screens in order:
- ETF screener: who passes your label, yield, expense, and AUM rules?
- ETF Heatmap: among those label peers, who ranks strong or weak on yield, fees, and return context?
The screener narrows. The heat map ranks. Neither tells you what to buy. Both help you spend time on the right tickers.
The income ETF workflow
| Step |
Tool |
You get |
| 1 |
ETF screener |
4–8 tickers in the same label family |
| 2 |
ETF Heatmap |
2–3 finalists with peer ranks (Pxx) |
| 3 |
Holdings check |
Overlap and concentration verified |
Compare inside one label at a time. SCHD and BND can both be "income," but they should never share a heat map row.
Step 1: Screen in the ETF screener
Open the ETF screener. Use the Dividend & income quick view or select the Dividend / Income label chip.
Set two or three rules:
- Market cap (AUM) floor: liquidity for your trade size
- Expense ratio ceiling: fee drag on long holds
- Sort by dividend yield: a reasonable first scan for equity income
Save the view so next week's run compares like with like.

Output: a shortlist in one label family. That list feeds the heat map, not your final answer.
For bond income, switch to the Bonds label and compare inside bond peers only. Read best ETF screener workflow for the weekly habit.
Step 2: Rank in the ETF Heatmap
Open the ETF Heatmap. The built-in Income view loads dividend-labeled funds with bond, leveraged, and crypto exclusions and an AUM floor.
Expand the Dividend / Income label row. Each ETF cell shows Pxx, its rank among siblings in that label, with the raw value underneath (yield, expense, AUM, 1Y min gap).
What to read:
- Yield Pxx + expense Pxx: fee-efficient income vs label peers
- Yield Pxx + weak 1Y min gap Pxx: possible yield trap (price fell faster than payout adjusted); investigate, do not auto-reject
- Blank cells: missing peer data, not a hidden weak score
Turn Complete rows only on for a clean grid. Turn it off when you want to inspect partial rows.

Add columns via Columns when you need 1M Chg, Top 10 weight, or bond fields like Yield to maturity. Use the Income sort preset (yield → expense → AUM) or the view's default sorts.
Output: two to three finalists with a note on why each survived and what would disqualify it.
For percentile habits, read how to use an ETF heat map and how to compare ETFs.
Step 3: Verify holdings
Two dividend ETFs with similar heat map ranks can hold very different stocks.
Before you allocate:
- Read each fund's top holdings (prospectus or issuer factsheet).
- Check overlap with ETFs and stocks you already hold.
- Optional: load top names into the stock heat map for dividend context on underlying equities.
Holdings verification is step three on purpose. The screener and heat map do the fund-level work.
Income types: one label per compare
| Mandate |
Screener label |
Heat map rule |
| Dividend equity |
Dividend / Income |
Expand Dividend / Income row only |
| Investment-grade bonds |
Bonds |
Use Bonds view, not Income |
| Covered-call income |
Options-based / strategy |
Compare vs same strategy peers, not SCHD |
FAQ
How do I choose a good income ETF?
Write the income job, screen with label + filters, rank finalists in the ETF Heatmap on yield, fees, and return context, then verify holdings and overlap. Read the prospectus before you allocate.
Why use both the screener and the heat map?
The screener answers who passes your rules now. The heat map answers who ranks best among label peers. Sorting yield alone skips peer context; heat mapping without screening wastes time on the wrong universe.
What is the best income ETF?
There is no universal best. The best fund matches your mandate, cost tolerance, liquidity needs, and existing overlap.
Are high-yield ETFs always better?
No. Higher yield can reflect higher risk, a recent price drop, or a distribution policy you may not want. Pair yield rank with expense and recent return ranks in the heat map.
What is a yield trap?
A common pattern: high dividend yield percentile with weak recent return percentile among label peers. It is a research flag, not proof of a bad fund.
Is this investment advice?
No. Research workflow notes only. Portfolio decisions remain yours.
Run it in Buydy
- ETF screener → filter and sort
- ETF Heatmap → rank finalists
- Resources and 12 months free, no credit card required
Research summaries, not investment advice.