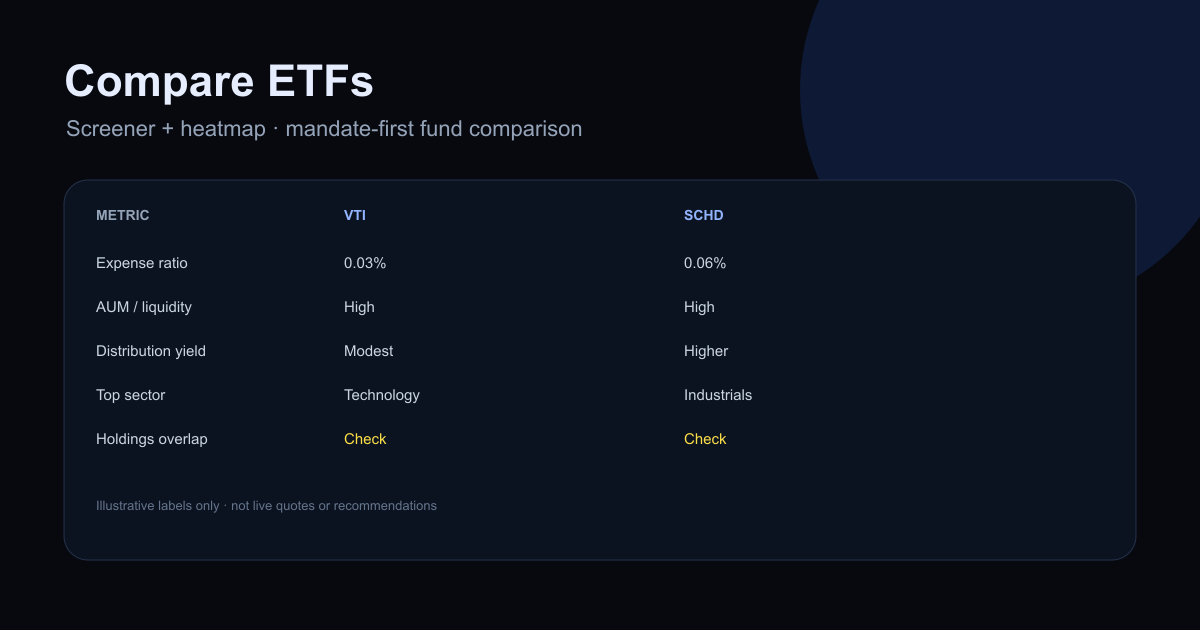
To compare two ETFs, first confirm that they serve the same job. Then compare the benchmark, holdings overlap, concentration, total ownership cost, tracking difference, liquidity, distributions, and tax treatment. Compare past returns only after those checks, using the same currency and time period.
That order matters. Two funds can have similar names but hold different markets. They can also track the same index yet produce slightly different investor returns because of fees, taxes, replication, securities lending, and trading costs.
This guide gives you a repeatable ETF vs ETF comparison process. You can use it in a spreadsheet or with Buydy's two live ETF research screens: the ETF screener to filter the universe, and the ETF heatmap to rank comparable funds within label peer groups.
Quick answer: how to compare two ETFs
Put both fund factsheets beside each other and check these eight items in order:
- Objective and benchmark: are the funds trying to do the same job?
- Holdings overlap: how much of each fund is invested in the same securities?
- Concentration: what percentage sits in the top 10 holdings, sectors, or countries?
- Ongoing cost: expense ratio or TER, plus any platform fee.
- Tracking quality: how closely and consistently does each fund follow its index?
- Liquidity: fund size, bid-ask spread, and liquidity of the underlying holdings.
- Fund structure: domicile, replication, distributing vs accumulating, and currency hedging.
- Equal-period total return: compare only after the first seven checks.
If the benchmarks are different, do not call the higher-return fund the winner. First decide which exposure belongs in your portfolio.
ETF comparison table: what to put side by side
Use this as a spreadsheet template or decision memo:
| Comparison field |
What to record |
Why it answers the user's question |
| Goal |
Core, income, bonds, factor, sector, or country tilt |
Different jobs should not be ranked as substitutes |
| Benchmark |
Full index name and weighting method |
Similar fund names can hide different rules |
| Holdings overlap |
Weighted overlap, not just shared-name count |
Shows whether the second ETF adds diversification |
| Top 10 weight |
Percentage of fund assets |
Reveals concentration that holdings count can hide |
| Sector and country weights |
Largest differences in percentage points |
Explains why returns diverge |
| Expense ratio or TER |
Annual fund charge |
A recurring drag, but not the full cost |
| Tracking difference |
Fund return minus index return over equal periods |
Shows the result of fees and implementation |
| Spread and size |
Typical bid-ask spread and AUM |
Helps assess trading friction and closure risk |
| Distribution policy |
Accumulating or distributing, yield definition |
Changes cash flow and sometimes tax handling |
| Structure |
Domicile, replication, hedging, lending |
Can affect risk, tax, and tracking |
| Total return |
Same dates, currency, and dividend treatment |
Makes performance comparable |
Do not compare price charts alone. An ETF price can look lower because of its launch date, share split, currency, or distribution policy. The share price does not tell you whether the fund is cheap.
Screen first, then compare ETF peers
Use the ETF screener to narrow the universe by mandate, label, expense ratio, AUM, yield, and other available fund fields. Save repeatable filters so each review compares like with like.
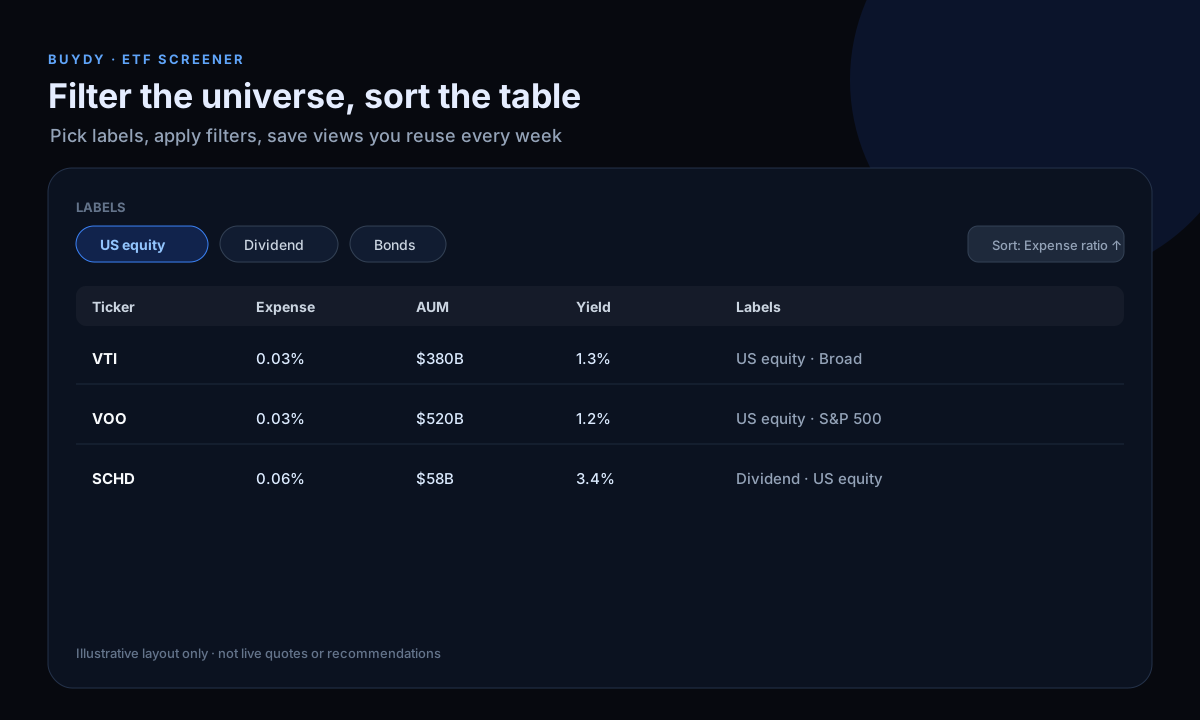
Once you have two to six comparable finalists, use the ETF heatmap for peer context:
- Each label row summarizes averages; expand the row to rank sibling ETFs together.
- Cells show percentile ranks (Pxx) within that label peer group, with raw values available for verification.
- Blank cells mean insufficient peer data, not a hidden weak score.

These screens organize the research. The factsheet, prospectus, full holdings, and your local tax rules remain the source for the final decision. For a repeatable cadence, read best ETF screener workflow.
Step 1: Compare each ETF's benchmark and objective
Check:
- Full index name, not only "S&P 500," "world," or "technology."
- Weighting method (market-cap, equal-weight, factor, or fundamental).
- Geography (US only, developed ex-US, emerging markets, global).
- Asset class (equity vs bond vs mixed).
- Share class (fee tier and ticker suffix).
Two tickers in the same category can still differ on eligible securities, rebalance frequency, sampling, securities lending, and dividend treatment. Download both factsheets and write the benchmark names in the comparison table. If they differ, explain the exposure difference before looking at returns.
Step 2: Measure ETF holdings overlap and concentration
Overlap answers a common question: "Am I diversifying, or buying the same companies twice?"
Use weighted overlap, not only the number of shared holdings. For every security found in both ETFs, take the smaller of its two portfolio weights, then add those smaller weights together. A focused ETF may sit almost entirely inside a broad-market ETF even when the reverse is not true.
Also compare:
- Top 10 weight: 500 holdings do not guarantee broad diversification if the largest 10 dominate.
- Largest shared positions: identify where duplicate exposure is concentrated.
- Sector and country differences: find the exposure you actually gain by owning the second fund.
- Portfolio-level overlap: compare both ETFs with funds you already own, not only with each other.
An overlap percentage is not automatically good or bad. It tells you what the combination does. Owning VOO with VTI, for example, creates an intentional US large-cap overweight rather than a new asset class.
Step 3: Compare total cost and liquidity
| Metric |
Why it matters |
| Expense ratio |
Compounds over decades; compare same share class. |
| Bid-ask spread |
A direct trading cost when you buy or sell. |
| Broker or platform fee |
Can outweigh a small TER difference for frequent contributions. |
| AUM and fund age |
Very small or new funds may have greater closure risk. |
| Underlying liquidity |
Often matters more than headline ETF trading volume. |
A fund five basis points cheaper is not automatically better if its spread, tracking, platform cost, or index fit is worse for your use case. For a long holding period, ongoing costs matter more. For frequent or large trades, spreads matter more.
Step 4: Compare tracking difference, not fees alone
For an index ETF, tracking difference is the fund's total return minus its benchmark return over the same period. Tracking error describes how variable that difference has been.
Check three-year or five-year figures when available, using identical dates. A consistently small shortfall can be more informative than the advertised fee because it reflects the combined effect of costs, cash drag, withholding tax, sampling, and securities-lending revenue.
Fidelity's guide to ETF tracking difference explains why the figure is rarely zero. Only compare tracking statistics when both ETFs follow the same benchmark.
Step 5: Compare fund structure and tax fit
Structure can decide between two otherwise similar ETFs:
- Physical, sampled, or synthetic replication: understand how the fund gets its exposure.
- Accumulating vs distributing: does the fund reinvest income or pay it out?
- Domicile: may affect withholding tax, reporting, and investor eligibility.
- Currency hedging: hedged and unhedged share classes carry different currency behavior.
- Securities lending: check whether it is allowed, collateral policy, and who receives the revenue.
- Account and local tax rules: the same ETF can have a different after-tax result in a taxable account, ISA, SIPP, PEA, or other wrapper.
For European investors, compare funds by ISIN first. One fund can trade under different tickers on several exchanges. Trading currency is not the same thing as currency exposure, and changing from a EUR listing to a GBP listing does not remove the currencies held inside the portfolio.
Step 6: Compare income and distributions
For income mandates, compare:
- Distribution yield (understand whether it is trailing twelve-month, SEC yield, or another definition).
- Distribution frequency and history of cuts.
- Growth vs high-yield policy (dividend growth ETFs vs high yield).
Yield alone is not quality. A higher yield can reflect sector bets, option income, return of capital, or a recent price drop. Compare total return as well as cash paid. For a full income ETF workflow, read how to select good income ETFs.
Step 7: Compare performance on equal terms
Use total return, including reinvested distributions, over identical start and end dates. Keep the reporting currency and benchmark treatment consistent.
Then ask:
- Did one ETF launch later, creating a shorter record?
- Is the difference explained by holdings, sector weights, or currency hedging?
- Did one comparison omit distributions?
- Is the winner simply taking more concentration or factor risk?
Use returns to understand what caused the difference, not to crown a winner from the best-looking line.
How to compare two ETFs tracking the same index
When both funds genuinely track the same benchmark, the comparison becomes narrower:
- Compare long-term tracking difference over matching dates.
- Compare expense ratio or TER.
- Check full replication, sampling, or synthetic replication.
- Compare domicile, dividend withholding treatment, and securities lending.
- Compare spread, AUM, fund age, and closure risk.
- Check accumulating vs distributing share classes.
Do not expect identical returns. Real funds hold cash, trade when an index changes, pay operating costs, handle tax, and may earn lending revenue.
Document the decision in five lines
For each finalist, write five lines:
- Mandate fit (yes/no and why).
- Cost and liquidity verdict.
- Overlap with existing holdings.
- Main risk (concentration, factor bet, rate exposure).
- What would remove the fund from consideration.
This memo survives the next performance headline.
Worked example: VTI vs VOO vs SCHD
| Ticker |
Typical role |
First comparison question |
| VTI |
US total market core |
Do you want the broadest US equity slice? |
| VOO |
S&P 500 core |
Are you fine with large-cap concentration vs total market? |
| SCHD |
US dividend equity tilt |
Is income the mandate, not broad beta? |
VTI and VOO are the closer comparison. VTI covers the US total market, while VOO tracks the S&P 500. Their large-company exposure overlaps heavily, but VTI adds mid- and small-cap stocks. Holding both does not add a new geography or asset class. It tilts a VTI position further toward the S&P 500. For a full walkthrough with tool-by-tool notes (Finviz, Yahoo Finance, brokers, Buydy), read compare VOO vs VTI.
SCHD is a different comparison because its dividend and quality screens create a narrower equity tilt. A higher yield does not make it a better replacement for a total-market core.
Run all three through the screener only after you answer which role you are filling. Use the heatmap when two tickers share a label and you need peer context on fees, yield, and return windows.
Build the shortlist in Buydy today
- Screen the universe with ETF screener workflows.
- Rank comparable finalists in the ETF heatmap.
- Verify the benchmark, overlap, structure, tracking, and tax fit from primary documents.
Every new account gets 12 months free with no credit card. See free access details, then run the checklist on a shortlist you already know.
FAQ
How do I compare two similar ETFs?
Start with each fund's objective and full benchmark name. Then compare weighted holdings overlap, top-10 concentration, sector and country weights, expense ratio, tracking difference, spread, size, structure, and distribution policy. Use equal-period total return last.
How can I compare two ETFs side by side?
Create two columns using the comparison table in this guide. Copy factsheet data for the benchmark, top holdings, sector weights, TER, size, replication, domicile, distributions, and tracking. Add weighted overlap and equal-period total return. Record the reason one fund fits your portfolio better rather than assigning a generic winner.
VTI vs VOO: which should I pick?
Pick VTI for the broadest US total market exposure. Pick VOO if you explicitly want S&P 500 large-cap exposure. Compare fees, tracking, and overlap with what you already hold. They are not interchangeable even when returns look similar. See the dedicated VOO vs VTI comparison guide for holdings overlap math and how common research tools display each fund.
Should I compare ETFs on performance alone?
No. Performance is useful context after you understand fees, exposure, and index rules. Performance alone hides structural differences.
How do I check overlap between ETFs?
Use complete holdings when possible. For each shared security, take the lower portfolio weight and sum those values. Also compare top-10 concentration and sector or country weights. A shared-name count misses how much money each ETF actually puts in those holdings.
Is the ETF with the lowest expense ratio always better?
No. A lower fee helps only after the fund passes the exposure test. Tracking difference, spread, platform fees, tax treatment, replication, and closure risk can outweigh a small expense-ratio advantage.
Does the trading currency of an ETF change its currency risk?
Usually not by itself. Currency exposure comes mainly from the underlying holdings and any hedging policy. The same fund may trade in EUR, GBP, or USD under different tickers while holding the same portfolio. Confirm this with the ISIN and factsheet.
Research summaries, not investment advice.