How do you use Buydy’s stock heat map? Open Stocks Heatmap, pick a preset like Top Losers, adjust filters if needed, sort with Weighted Average (Desc), hover cells to check raw numbers, then Export CSV. Green means strong vs peers on that metric. It is not a buy signal.
New to the colors? Read how to read a stock heat map first. This post is about the buttons and workflow.
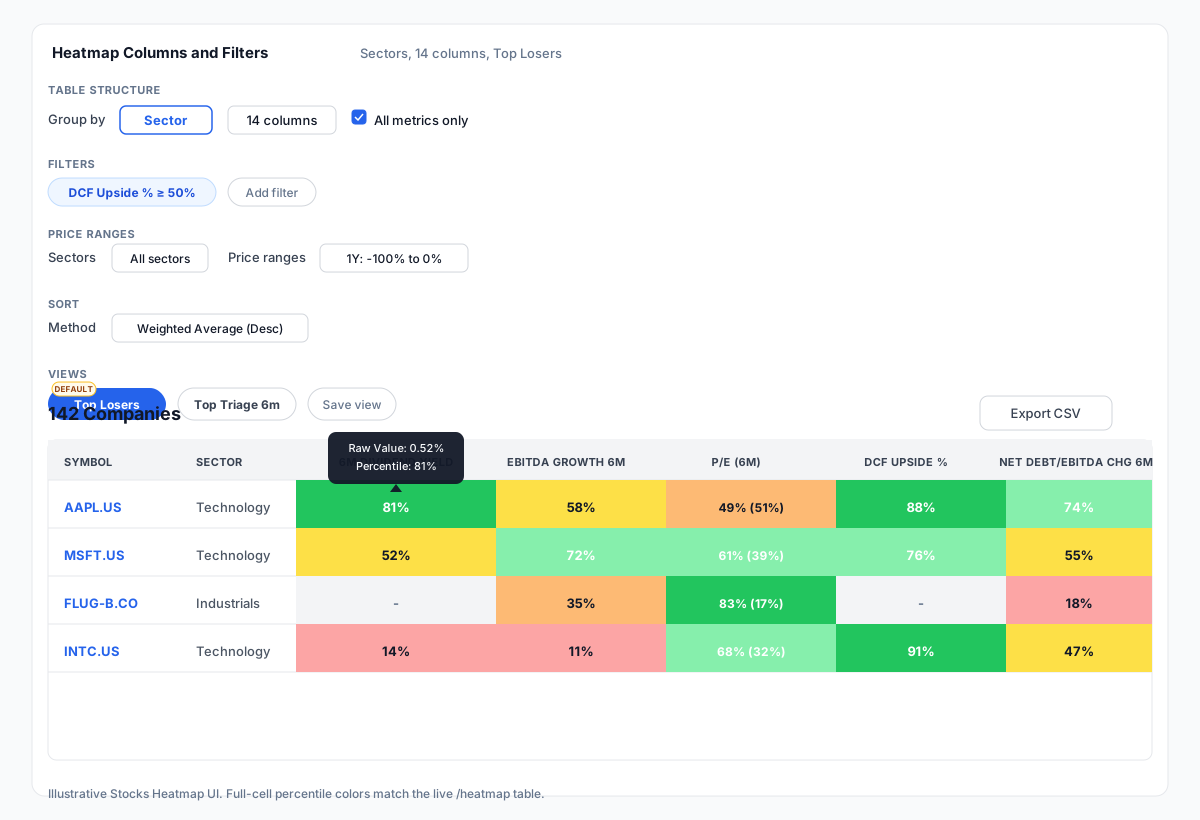
What is a stock heat map?
A stock heat map is a table that compares many large-cap stocks at once. Each colored cell shows how a company ranks vs sector or industry peers on one metric (yield, P/E, debt, price change, DCF upside, and more).
Buydy covers 4,000+ large-cap equities. ETFs do not appear here. Use the ETF screener or ETF Heatmap for funds.
Start with a preset
You do not need to build a screen from scratch. Two presets ship ready to use:
Top Losers (default) shows 14 columns for stocks down over the past year. It filters to 1Y: -100% to 0%, adds DCF Upside % ≥ 50%, and keeps All metrics only on. Use it after a selloff when you want names that still look decent vs peers.
Top Triage 6m is a lighter three-column pass: EBITDA Growth 6M, P/E (6M), and DCF Upside %. Same default filters apply. Use it for a quick scan.
Changed something by accident? Reset brings the preset back.
The controls that matter
Expand Heatmap Columns and Filters to see everything.
All metrics only hides rows missing data for your selected columns. Leave it on for cleaner lists. Turn it off only when you are exploring.
Filters narrow the list. Top Losers starts with DCF Upside % ≥ 50%. Add more with Add filter (sector, industry, or any metric).
Price bands (1W through 1Y) limit stocks by recent price change. Top Losers uses the 1Y band for decliners.
Group by switches peer context between Sector (broader) and Industry (tighter peers).
Sort → Weighted Average (Desc) ranks the table using your visible metrics. Price columns are left out so one hot month does not dominate. There is no extra score column. The sort order is the rank.
Hover a cell to see the raw value. Cells show percentiles (like 81%). Tooltips show the actual number.
A - on gray means no data, not a hidden bad score.
How to use the stock heat map in five minutes
- Open Stocks Heatmap.
- Pick Top Losers or Top Triage 6m (or a saved view).
- Set Group by to Sector or Industry.
- Confirm All metrics only is checked.
- Sort with Weighted Average (Desc).
- Click a few symbols to read company detail.
- Export CSV for your shortlist.
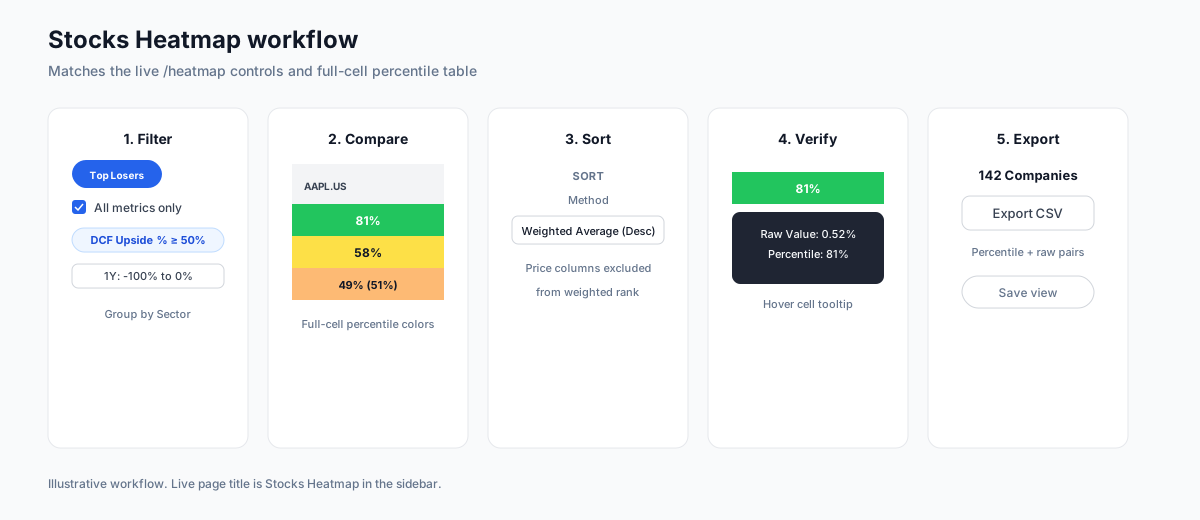
Save and export
Saved views remember your columns, filters, price bands, group-by, and sort. Save a screen once, reuse it every week.
Export CSV (above the table) downloads symbol, sector, industry, and each column as percentile plus raw value pairs.
For a full weekly rhythm across indexes, stocks, and ETFs, see the weekly market research workflow.
Stock heat map vs other Buydy tools
| Tool |
Use it when you want to… |
| Stock heat map |
Compare large-cap stocks on several metrics vs peers |
| ETF screener |
Filter funds by fees, size, yield, and similar rules |
| ETF Heatmap |
Rank shortlisted funds within peer groups |
Buydy does not have a separate equity screener page. You filter and rank on the stock heat map. More context: stock heat map vs stock screener. Moving from stocks to funds? See how to compare ETFs.
FAQ
How do you use a stock heat map?
Open Stocks Heatmap, pick a preset, confirm All metrics only, sort with Weighted Average (Desc), check tooltips, then Export CSV.
What is a stock heat map?
A table that colors each metric by rank vs sector or industry peers. It helps you decide what to research next.
Do cells show raw values or percentiles?
Percentiles in the cell. Raw values in the tooltip and on the company page.
Why are some cells blank?
Missing or insufficient data. The cell shows -, not a hidden score.
Does green mean buy?
No. It means ahead of most peers on that one metric.
Can I put ETFs on the Stock Heatmap?
No. Use the ETF Heatmap for funds.
Is Buydy free to use?
Every new user gets 12 months of full access free. Email and password only, no credit card. See pricing.
Next steps
Research summaries only; not investment advice.


