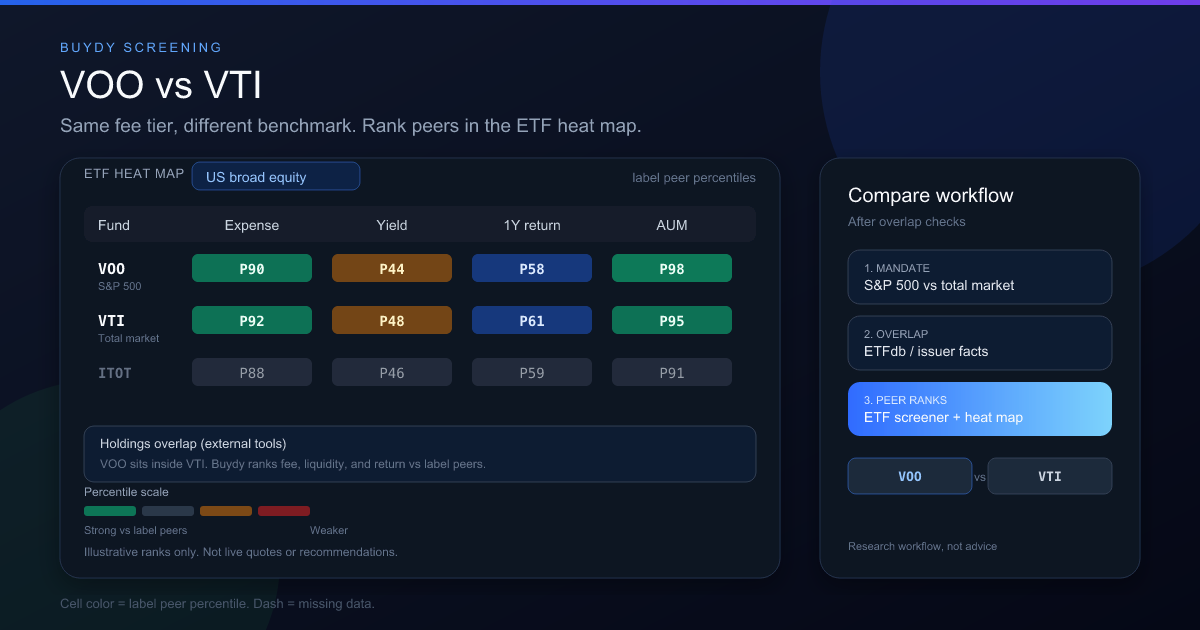
VOO vs VTI is one of the most common compare two ETFs searches in the US because both are low-cost Vanguard equity funds with similar charts. They are not the same product. VOO tracks the S&P 500 (large-cap US). VTI tracks the CRSP US Total Market Index, which includes the S&P 500 plus mid-cap and small-cap stocks.
If you only compare one-year performance or Finviz tile color, the funds look interchangeable. They are not. The decision is whether you want pure large-cap exposure or the broadest US equity slice in one ticker.
This guide walks through the fund facts, holdings overlap, when holding both is redundant, and how popular research tools display VOO and VTI so you know what each surface can and cannot answer.
For the full checklist on any pair of funds, start with how to compare two ETFs.
How to compare two ETFs (VOO vs VTI example)
Use this pair as a template for any side-by-side fund review:
- Match the job: VOO = S&P 500 large cap. VTI = US total market. Different benchmarks, not interchangeable tickers.
- Compare exposure before returns: holdings count, top-10 weights, and weighted overlap (VOO inside VTI is the usual story).
- Line up costs and liquidity: expense ratio, AUM, spread, tracking difference versus each stated index.
- Use two external compare tools: ETFdb for Holdings, StockAnalysis (or similar) for return windows, then verify on the issuer factsheet.
- Rank peers in your workflow: ETF screener plus ETF heat map when both funds sit in the same US broad equity label.
The generic eight-step checklist lives in how to compare two ETFs. The sections below apply that process to VOO vs VTI and show how ETFdb and StockAnalysis display the difference.
Quick answer: VOO vs VTI at a glance
| Field |
VOO (Vanguard S&P 500 ETF) |
VTI (Vanguard Total Stock Market ETF) |
| Index |
S&P 500 |
CRSP US Total Market |
| Typical role |
US large-cap core |
US total market core |
| Holdings count |
About 500 names |
About 3,500+ names |
| Large-cap overlap |
Defines the fund |
Includes essentially all S&P 500 weights plus smaller names |
| Expense ratio |
Very low (check current prospectus) |
Very low (check current prospectus) |
| Domicile |
US |
US |
| Replication |
Physical (full or sampling; read prospectus) |
Physical (full or sampling; read prospectus) |
Pick VOO when you explicitly want S&P 500 large-cap beta and you are fine without extended market exposure.
Pick VTI when you want one fund to cover large, mid, and small US companies without stacking another broad fund on top.
Avoid holding both as two separate core positions unless you are intentionally overweighting large cap relative to a total-market weighting. VTI already embeds the S&P 500. Adding VOO mostly tilts you further toward the same mega-cap names.
Numbers in the table change. Always confirm expense ratio, AUM, and index policy on each fund's current factsheet before you trade.
VOO vs VTI vs SPY vs IVV (quick decision table)
Searchers often mix S&P 500 trackers with total market funds. Use this table before you read performance charts.
| Ticker |
Index / role |
Fee tier (typical) |
When it fits |
| VOO |
S&P 500 large-cap core |
Very low |
You want the S&P 500 explicitly |
| VTI |
CRSP US total market |
Very low |
You want one broad US equity fund |
| SPY |
S&P 500 |
Low (often higher than VOO/IVV) |
You need options liquidity or legacy SPY workflow |
| IVV |
S&P 500 |
Very low |
S&P 500 alternative to VOO on another issuer |
VOO vs VTI is a benchmark choice, not a fee race. SPY vs VOO vs IVV is which S&P 500 wrapper you prefer after you already decided on large-cap US beta.
Why the benchmarks differ (and why it matters)
The S&P 500 is a committee-selected large-cap index. The CRSP US Total Market index covers nearly investable US equities, including stocks too small for the S&P 500.
In practice:
- Return paths for VOO and VTI track closely most years because US large caps dominate total market capitalization.
- Risk and drawdown shape can differ when small caps lead or lag, because VTI carries that sleeve and VOO does not.
- Top-10 concentration is high in both, but VTI spreads a small additional weight across thousands of smaller names.
When you compare two ETFs for a portfolio role, benchmark rules beat brand recognition. Vanguard sponsors both funds, so "same company" is not a reason to own both at full weight.
Holdings overlap: the number that stops double counting
Weighted overlap answers: If I own both funds, how much money is invested in the same securities twice?
Conceptually, almost every S&P 500 stock appears inside VTI with similar large-cap weights. A simplified overlap check:
- Download or view full holdings for both funds (issuer site, ETF Database, or your broker).
- For each ticker held in both funds, take the lower of the two portfolio weights.
- Sum those min weights across shared names.
You will usually find very high overlap between VOO and VTI on the large-cap core. That is expected, not a bug.
What overlap does not tell you: whether mid and small caps are worth the extra complexity. That is a portfolio design choice. Overlap only tells you that VOO plus VTI is not the same as adding international or bonds.
For a reusable overlap method on any pair, see the overlap section in how to compare two ETFs.
Costs, liquidity, and tracking (where the tools agree)
On most quote pages, VOO and VTI look identical on expense ratio: both are among the cheapest US equity ETFs. Differences show up in:
- Bid-ask spread at your broker (often tight for both; check at your trade size).
- AUM and volume (both are large; closure risk is low for either).
- Tracking difference versus each fund's stated index over 1, 3, and 5 years (small fee drag plus securities lending and sampling effects).
When a screener sorts by "lowest fee only," VOO and VTI tie. The tie-breaker is benchmark fit, not another 0.01%.
Competitor example 1: ETFdb ETF Comparison (VOO vs VTI)
ETFdb is one of the most linked compare two ETFs tools in US forums. The direct pair URL pattern is:
https://etfdb.com/tool/etf-comparison/voo-vti/
(You can swap tickers in the path for other pairs.)
What you do
- Open the comparison tool and confirm both VOO and VTI are selected.
- Start on Overview for index name, expense ratio, AUM, dividend yield, and holdings count. This is where VOO vs VTI stops looking identical: VOO stays near ~500 S&P names; VTI shows thousands of total market names.
- Switch to Holdings when expense ratio ties. This tab is the reason people send ETFdb links for VOO vs VTI threads. You see shared holdings, sector weights, and overlap-style breakdowns that make the "same Vanguard fee" story visible as different exposure.
- Use Performance only after you accept the benchmark difference. Equal-window charts are useful context, not the tie-breaker.
What VOO vs VTI typically shows on ETFdb
| Question |
What ETFdb helps with |
What to verify elsewhere |
| Same fee? |
Overview expense ratio |
Prospectus for current TER |
| Same stocks? |
Holdings overlap visuals |
Issuer factsheet for full weights |
| Same role? |
Index labels on Overview |
Your portfolio job statement |
| Can I hold both? |
Holdings tab redundancy |
Your target allocation |
Limits
ETFdb is strong on fund facts and holdings context. It is not a portfolio X-Ray for your whole account, and free tiers may cap export depth. Treat it as the holdings and overlap step, not the final tax or broker-cost memo.
Screenshot: ETFdb VOO vs VTI compare (Overview). Numbers change; verify on the live page.
Competitor example 2: StockAnalysis ETF Compare (VOO vs VTI)
StockAnalysis publishes permanent VOO vs VTI compare pages that rank well for search. Example:
https://stockanalysis.com/etf/compare/voo-vs-vti/
What you do
- Open the compare URL (or search
VOO vs VTI and pick the compare result).
- Read the summary table first: assets, expense ratio, P/E on the basket, dividend yield, and day change. VOO and VTI often match on 0.03% fee and similar yield, which tricks skimmers into thinking the funds are duplicates.
- Scroll to return windows (YTD, 1Y, 5Y, 10Y, inception). VOO can edge VTI in periods when large caps outperform extended market. That gap is a benchmark story, not proof that VOO is "better" for every goal.
- Open top holdings for each column. Both lists start with the same mega-cap names at similar weights. The teaching moment is what VTI adds below the top ten: many smaller weights VOO does not hold at all.
What VOO vs VTI typically shows on StockAnalysis
| Surface on the page |
VOO |
VTI |
Reader takeaway |
| Category label |
Large blend / S&P 500 |
Often labeled broad US equity |
Read the index line, not only category |
| Holdings count |
~500 |
~3,500+ |
VTI is broader by construction |
| Top 10 |
Mega-cap heavy |
Mega-cap heavy |
Overlap is high in the head names |
| 10Y return |
Slightly higher some windows |
Slightly lower when small caps lag |
Performance follows cap mix |
Limits
StockAnalysis compare pages excel at fast side-by-side stats and return tables. They usually do not print a single weighted overlap percentage, and third-party fund names can differ from Vanguard's exact index wording. Cross-check benchmark text on Vanguard's fund pages before you trade.
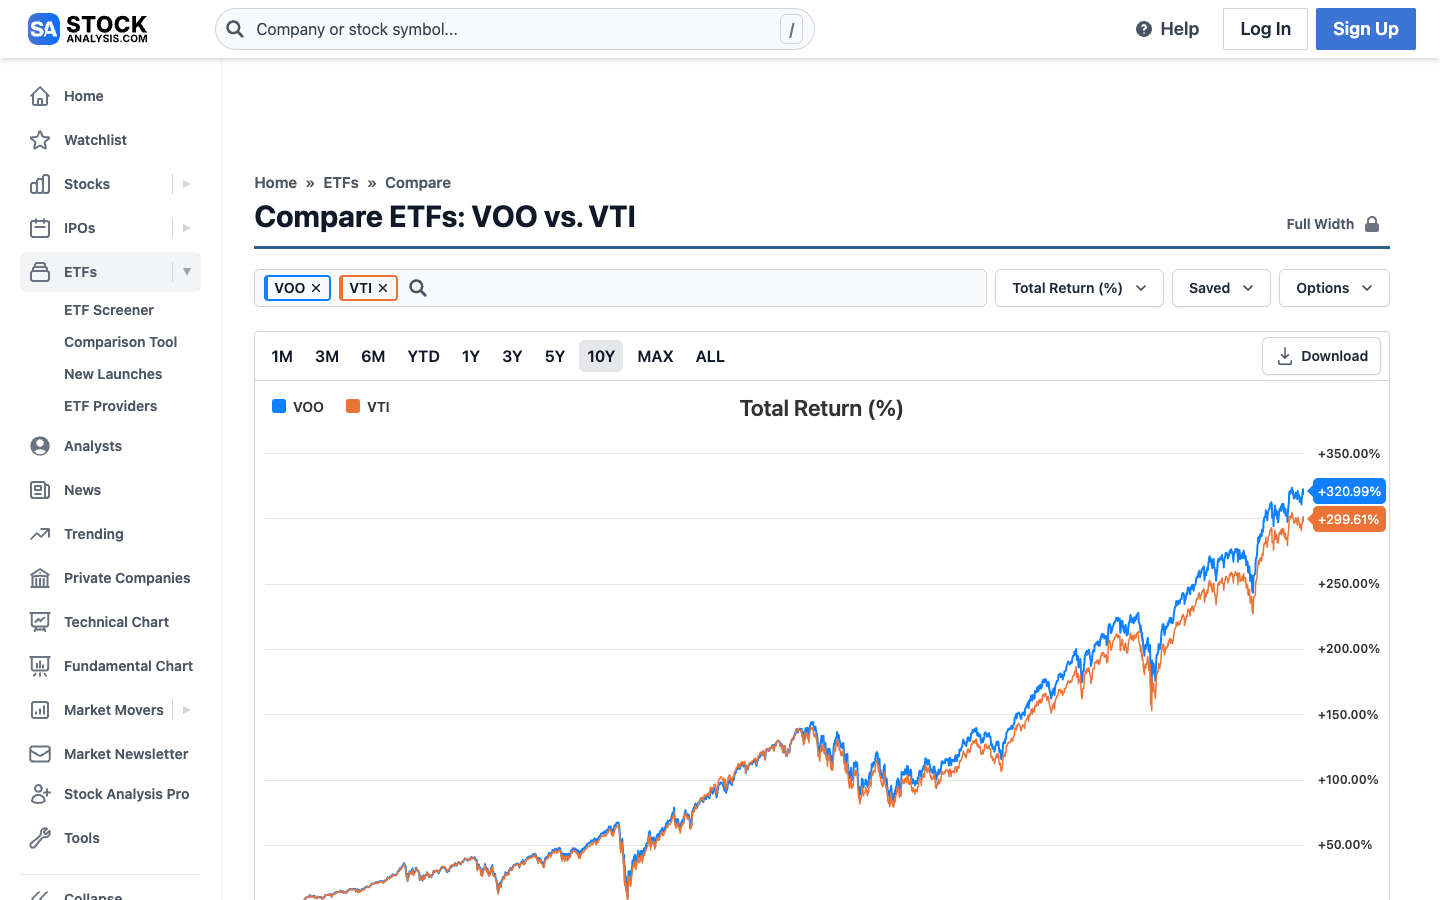
Screenshot: StockAnalysis compare page. Use issuer factsheets for benchmark wording.
After ETFdb and StockAnalysis, use Finviz ETF heat map alternatives for weekly performance context, Morningstar Stock Intersection when both funds are already in a portfolio, or ETF Research Center for a pairwise overlap percentage. Issuer documents remain the source of truth for replication, distributions, and tax forms.
What popular VOO vs VTI articles emphasize (examples)
Most compare VOO vs VTI blog posts reach the same structural conclusion: fees tie, returns track closely, and overlap is high because the S&P 500 is a large slice of the total market. They differ in tone (pick one vs hold both) and in how they show overlap math.
| Source |
What they stress |
Useful takeaway for you |
| Motley Fool (Apr 2024) |
Large overlap between VTI and VOO; either fund can anchor a portfolio |
Mandate first: total market vs S&P 500, not brand |
| Mezzi |
Roughly low 80s percent weight overlap; VTI adds mid/small cap |
Extra volatility sleeve is small but real |
| ETF BFF overlap tool |
Every VOO holding sits inside VTI; argues against owning both at full weight |
Overlap tools answer "am I duplicating?" |
| ETF Research Center |
Publishes weighted overlap % and top shared names |
Good second opinion after ETFdb Holdings |
| BestETF.net compare |
Shared sectors (tech, financials, discretionary) and similar beta |
Sector tables explain why charts look identical |
| Forbes (VTI vs VOO overview) |
Side-by-side characteristics table; ~80% portfolio overlap cited |
Confirms the pair is a teaching example for how to compare two ETFs |
Those pieces are strong on story and overlap. They rarely help with repeat research: refreshing the same compare when you add ITOT, SCHB, or SCHX, or checking whether VOO and VTI still look "average" on liquidity and return windows versus other US broad funds after a market shift.
Where Buydy helps (and what we do not do)
Buydy is not a holdings overlap calculator. For weighted overlap percentages, use ETFdb Holdings, ETF Research Center, or similar tools cited above, then record the date.
Buydy does help on the next questions blog posts often skip:
| After the blog conclusion |
Buydy surface |
What you get |
| "Fees are the same, so either is fine" |
ETF heat map |
See whether VOO and VTI are typical or outliers on expense, AUM, yield, and return windows within the same label peer group, not in isolation |
| "Should I also look at ITOT / SCHB?" |
ETF screener |
Filter US broad equity (or your label), build one shortlist, avoid one-off ticker chasing |
| "Top holdings are the same mega caps" |
Stock heat map |
After you pick a fund, inspect underlying names on sector/industry percentiles (ETF tickers stay on the fund tools) |
| "I need a workflow I can rerun monthly" |
Screener → heat map habit |
Same steps as best ETF screener workflow, saved filters instead of rereading static articles |
Example: from blog advice to a Buydy pass
- Read any VOO vs VTI article for the mandate decision: total market (VTI) vs S&P 500 (VOO). If overlap tools say you already own the same core, do not add the other at full weight.
- Open the ETF screener and filter to your US broad equity label plus sane AUM and expense bounds. Add VOO, VTI, and any blog-mentioned alternates (for example ITOT or SCHB) to one watchlist.
- Open the ETF heat map, expand that label row, and compare percentile ranks on expense ratio, size, yield, and return columns. Blogs often stop at "0.03% for both." The heat map answers whether other peers cluster the same way this week and which metric separates finalists.
- If one fund wins on mandate but looks weak on liquidity or a return window, note it in your memo. That is a research flag, not a sell signal.
- Optional: export or note top holdings, then spot-check mega-cap names on the stock heat map if single-name risk matters to you.
For positioning next to Finviz-style maps and generic screeners, read Buydy vs generic ETF screeners and Finviz ETF heat map vs ETF screener.
Screenshot: Buydy ETF heat map feature page. Live app shows your saved shortlists and current peer ranks.
Side-by-side workflow you can repeat for any two tickers
- Write the job in one sentence (US large-cap core vs US total market core).
- Copy benchmark names from both prospectuses.
- Record expense ratio, AUM, spread, and distribution type (accumulating vs distributing does not apply to these US funds, but it matters for UCITS readers comparing US-listed tickers).
- Run weighted overlap if you might hold both or already own one.
- Compare equal-period total return only after steps 1 to 4.
- Save the table. Re-run when you add a third fund (for example a dividend tilt) so you do not compare unlike mandates.
This is the same workflow as best ETF screener workflow, applied to a concrete pair.
FAQ
Is VTI better than VOO?
Neither is universally better. VTI fits a total US market mandate. VOO fits an explicit S&P 500 large-cap mandate. Compare benchmarks first, then fees and tracking. Higher recent return on one fund is often a large-cap vs extended-market story, not proof of long-term superiority.
Can I hold VOO and VTI together?
You can, but at full weight in both you usually double up on the same large-cap core because VTI already holds the S&P 500 sleeve. Many investors pick one broad US equity fund. If you hold both, size VOO as an intentional large-cap tilt, not two separate cores.
What is the overlap between VOO and VTI?
Overlap on shared large-cap names is high. Exact weighted overlap changes with rebalance dates. Use ETFdb Holdings, an overlap tool, or a holdings download and sum the lower weight for each shared ticker. Do not rely on a stale percentage from a blog or forum.
Should I buy VOO or VTI for a long-term US portfolio?
Buy VTI if you want total US market exposure in one fund. Buy VOO if you deliberately want S&P 500 large-cap exposure only. Do not buy both at full weight unless you accept a large-cap overweight.
How much overlap is there between VOO and VTI?
Same answer as above: treat overlap as high on the mega-cap core, then verify with current holdings. Mid and small cap exposure lives in VTI only.
Why do VOO and VTI perform almost the same some years?
US large caps dominate market cap. When mega caps lead, total return paths converge. Years when small caps outperform are when VTI can diverge from VOO.
Can I compare VOO and VTI on Finviz alone?
Finviz is useful for performance context and quick quotes. Use ETFdb Holdings, an overlap tool, or issuer holdings for benchmark and overlap precision.
What is the best tool to compare two ETFs like VOO and VTI?
Use ETFdb or StockAnalysis for the first side-by-side pass, holdings or overlap tools when fee ties, Morningstar X-Ray when both are already in your portfolio, and Buydy screener plus ETF heat map when you want peer rank among US broad equity funds. See ETF screening workflows.
Does comparing VOO vs VTI help with "how to compare two ETFs" in general?
Yes. The pair is a teaching example: same sponsor and similar fees, different benchmarks and overlap. The same steps apply to UCITS pairs (for example IWDA vs VWCE) with different tickers and tax wrappers.
Every new Buydy account includes 12 months of free access with email registration only. See pricing, then run VOO and VTI through the screener and heat map on your own shortlist.
Research summaries, not investment advice.