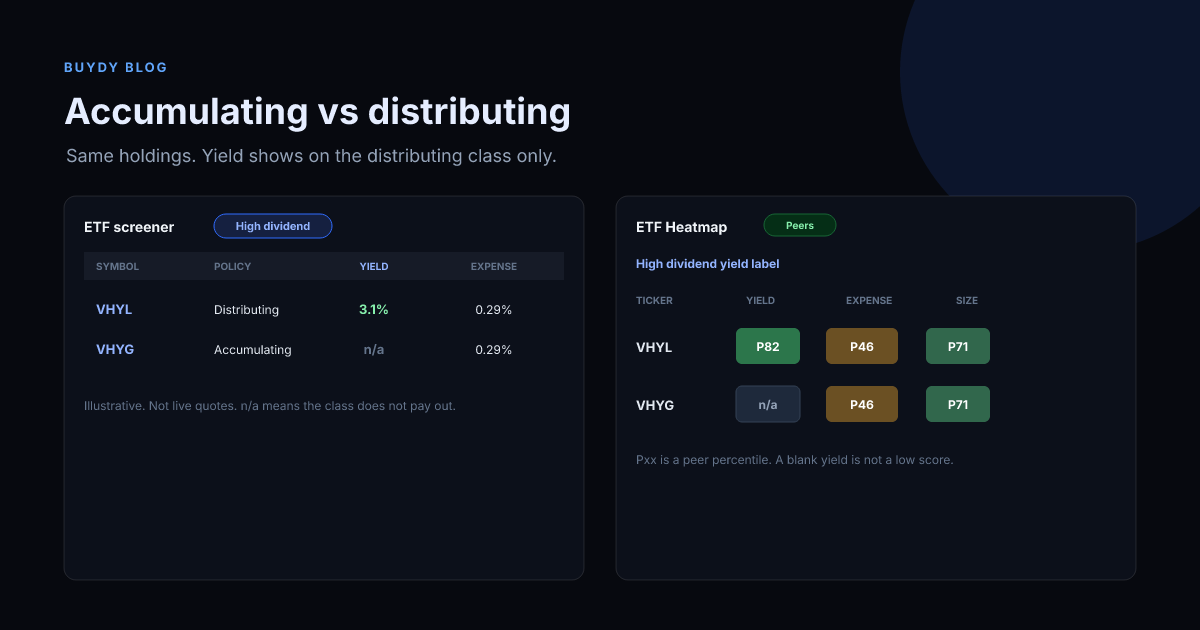
An accumulating ETF keeps dividends inside the fund and buys more of the holdings. A distributing ETF pays those dividends out to you. If the two share classes hold the same stocks, a raw price chart hides the gap, because the distributing line drops the cash on ex-dividend day and your chart never adds it back.
That is the whole confusion behind VHYG versus VHYL, and behind pairs such as FYEM and FYEQ. The holdings can match. The lines can still look stuck together for months. The compounding is in the accumulating share price, and in the cash the distributing share already sent you.
Quick answer
Use the accumulating share class when you do not need the cash and your account treats reinvestment cleanly. Use the distributing share class when you want income paid out. Compare them on total return, which adds the distributing dividends back, not on the price chart alone.
Confirm the current factsheet before you buy. Share class names, fees, and tax treatment change, and a ticker alone is not the policy.
VHYG and VHYL are the same portfolio with two cash policies
Vanguard's VHYG and VHYL are the usual example. Both follow a global high-dividend stock index. The letter in the name is the cash policy, not a different set of companies.
- VHYG reinvests dividends inside the fund. That is the accumulating class. People use it when they want the dividend to stay invested.
- VHYL collects the dividends and pays them to you. That is the distributing class. People use it when they want the income in cash.
On the day VHYL goes ex-dividend, its price falls by about the cash that left. That cash shows up in your account, not in the price line. VHYG uses the same cash to buy more of the holdings, so its price does not take that drop. If you add VHYL's paid dividends back, the two should track each other, minus a small gap from fees, withholding inside the fund, and tracking.
justETF and many broker charts default to price. They will not add the distributing dividend back unless you switch the chart to total return. Identical holdings plus a price chart is why the accumulating fund does not look like it is compounding.
A worked example, labeled as illustrative
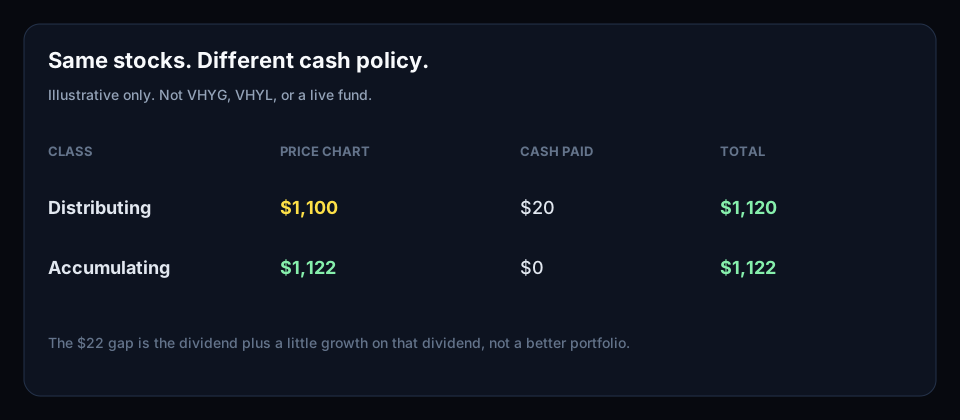
These numbers are a teaching example, not a quote for VHYG, VHYL, or any live fund.
Start with $1,000 in each share class. Over the year the stocks rise 10%, and they pay a 2% dividend, which is $20.
| Share class |
What happens to the $20 |
Price you see |
Cash you received |
Wealth if you count both |
| Distributing |
Paid out to you |
$1,100 |
$20 |
$1,120 |
| Accumulating |
Kept and invested, then the rise applies to it too |
about $1,122 |
$0 |
about $1,122 |
The distributing price chart shows $1,100. The accumulating price chart shows about $1,122. The $22 gap is not a better portfolio. It is the $20 dividend plus a bit of growth on that $20. If your chart ignores the $20, the distributing fund looks like it lagged.
Over a few months a dividend of a couple percent is smaller than the market's own move, so the two lines still look glued together. Stretch the chart over several years, and switch both to total return. That is when the compounding gap shows up.
Why FYEM and FYEQ look the same on a price chart
FYEM (accumulating) and FYEQ (distributing) are the same lesson with different tickers. If you open both factsheets, the holdings can be identical. Plot the prices and there is no obvious compounding line pulling away.
You are not missing a secret outperformance. You are missing the cash that FYEQ already distributed. The accumulating class did not "beat" the distributing class. It kept the dividend in the net asset value. The distributing class handed that dividend to the holder, so a price-only chart deleted it.
Check three things before you call one class better:
- Same index and same holdings. If the benchmarks differ, stop. You are not comparing share classes.
- Total return, same dates, same currency. Add distributions back on the distributing class.
- Fee and withholding. A small tracking gap can remain after you do the addition. That gap is implementation, not a hidden compound rate.
Tax can matter more than the chart
The label does not tell you the tax. In some accounts a distributing payment is taxed when it is paid, even if you reinvest it yourself. An accumulating fund may defer that tax until you sell, or it may not, depending on the country, the fund domicile, and whether the account is a pension or a taxable brokerage.
Do not pick VHYG only because the price line is higher. Do not pick VHYL only because you like seeing cash. Read the share class tax note on the factsheet, then match it to your account. This article is not tax advice.
What to check before you choose a class
Use the same order as any other ETF comparison:
- Job of the fund. High-dividend global stocks, broad market, or something else. VHYG and VHYL are an income tilt, not a plain all-world tracker.
- Distribution policy. Accumulating or distributing. This is the decision in this article.
- Ongoing cost. Expense ratio or TER against the other class and against a cheaper fund on a broader index.
- Yield definition. A distributing yield is cash paid. An accumulating fund can show a lower or blank distribution yield because it does not pay you. Do not call the accumulating fund "low yield" for that reason.
- Size and spread. A tiny share class can be awkward to trade even when the portfolio is large.
- Total return. Same window, dividends included.
For income funds in general, screen the mandate before the yield. The income ETF guide covers that filter. A high trailing yield can be a price that fell, not a dividend that grew.
Where Buydy fits
Buydy does not replace the factsheet, and it does not draw a total-return chart of VHYG against VHYL. It does let you compare funds on the fields that survive after you understand the share class.
The ETF screener filters by label, expense ratio, yield, and other available fund fields. The ETF heat map ranks funds inside a category label with peer percentiles. A blank cell means the metric was declined, not that the fund is a poor score. Read the yield column with the share class in mind: a distributing class and an accumulating class of the same index are not two different portfolios.
Live views are open with no login. Saved views and CSV export need a free account. Buydy is 100% free. No credit card.
What this is not
An accumulating class is not automatically the higher return. A distributing class is not automatically the income product you should live on. A 90% launch figure, a single stock, or a price line without dividends is the wrong comparison.
If you need the cash, take the distributing class and count the cash. If you do not, take the accumulating class and judge it on total return. Then compare fees and holdings with a second fund only after those two lines are in the same units.