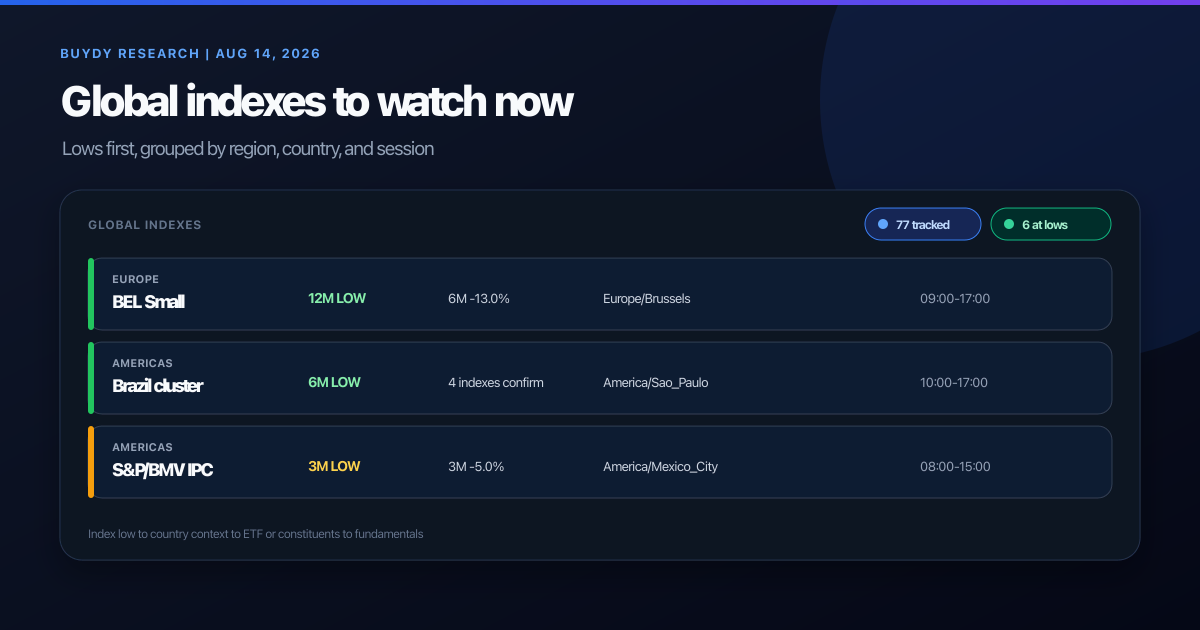
Which global indexes deserve attention right now? Based on Buydy's production snapshot through August 14, 2026, the clearest signals are BEL Small at a 12-month low, a Brazil cluster at six-month lows, and Mexico's S&P/BMV IPC at a three-month low. In Asia, the Shanghai Composite has not triggered a low signal, but it is close enough to its 12-month floor to remain on the watchlist.
That is the short answer. The useful answer is a process: begin with confirmed lows, group duplicate signals by country, check which market is open, then move from the index to an investable ETF or constituent list.
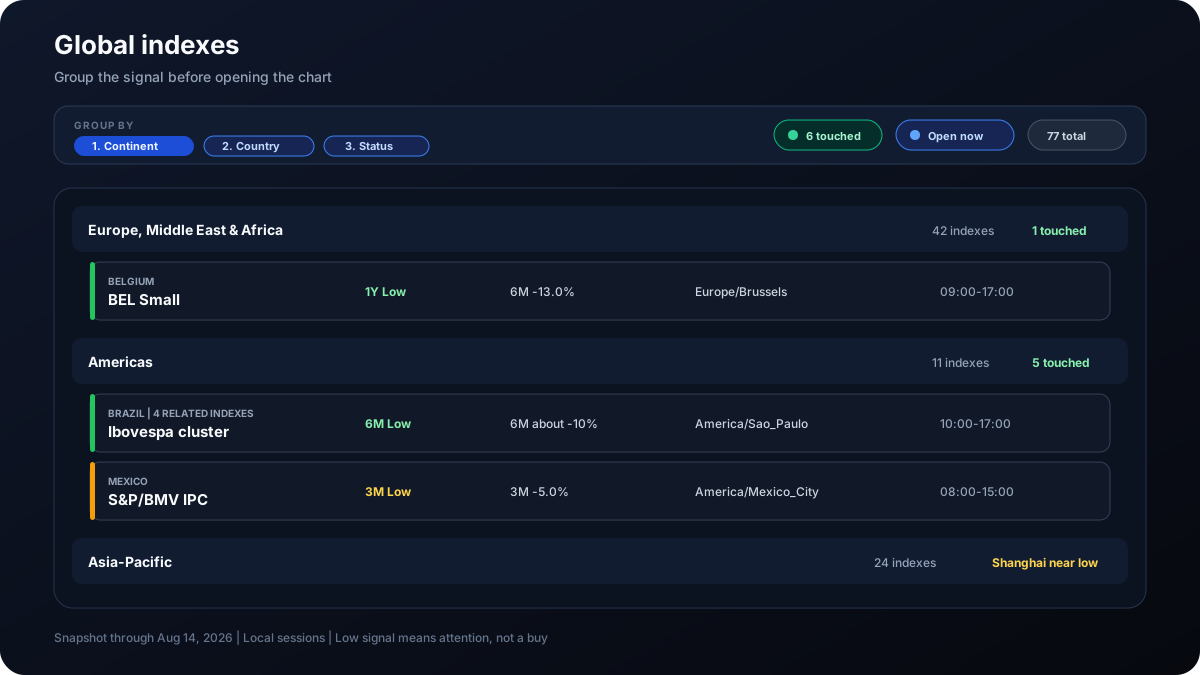
Global indexes to watch now
Buydy currently tracks 77 global indexes. Six triggered a rolling-low signal in the latest snapshot, but four of those six are related Brazilian benchmarks. Counting every Brazilian index as a separate opportunity would exaggerate the evidence, so the table groups them into one country signal.
| Priority |
Market signal |
Why it deserves attention |
| 1 |
BEL Small, Belgium: 12-month low |
The cleanest long-horizon dip. It is 18.4% below its 12-month high and down 13.0% over six months. |
| 2 |
Brazil cluster: six-month lows |
IBRA, Ibovespa, IBrX 50, and MidLarge Cap all confirm broad country weakness. The major measures are down roughly 9.5% to 10.9% over six months. |
| 3 |
S&P/BMV IPC, Mexico: three-month low |
A fresh regional dip: down 5.0% over three months and 9.7% over six months. |
| 4 |
Shanghai Composite, China: near-low watch |
No threshold was hit, but the index is only 5.4% above its 12-month low and down 5.0% over three months. |
| 5 |
Sensex and NIFTY 50, India: secondary watch |
Both remain above their lows, but six-month returns are still negative. This is a watchlist, not a confirmed dip signal. |
The S&P 500 and Australian large-cap indexes are useful controls, not dip candidates. They sit close to their 12-month highs. That contrast helps prevent a common mistake: treating every red day as a global buying opportunity.
Read the signal before hunting the opportunity
A rolling low answers one narrow question: has this index reached the lowest level in a defined window?
It does not answer:
- whether earnings estimates are still falling;
- whether the currency is weakening;
- whether the decline is concentrated in one sector;
- whether an investable fund tracks the index;
- whether the underlying companies are financially healthy.
The window matters too. BEL Small at a 12-month low is a stronger duration signal than Mexico at a three-month low. Brazil's six-month signal is more convincing because several related benchmarks agree, but those benchmarks are not independent observations.
In Buydy, a highlighted low means attention, not positive momentum and not a buy recommendation.
Group the world before you scan it
A flat list of 77 indexes is noisy. The faster workflow is to group information from broad to narrow:
- Region: Americas, Europe/Middle East/Africa, or Asia-Pacific.
- Country: combine related indexes so one country does not dominate the screen.
- Low status: put confirmed 12-month, six-month, and three-month lows first.
- Session: separate markets that are open now from markets waiting for their next session.
- Timezone or exchange: keep local market context visible before opening a chart.
This is why Buydy supports grouping by continent, country, status, session, timezone, and exchange. The same data becomes easier to read when the hierarchy matches the question.
Follow the market day across regions and timezones
“Open now” is dynamic. This article was prepared on a weekend, so the useful reference is the normal local session sequence rather than a frozen open/closed label.
| Region |
Country and index |
Local session |
Timezone |
| Asia-Pacific |
Australia, ASX indexes |
10:00–16:00 |
Australia/Sydney |
| Asia-Pacific |
China, Shanghai Composite |
09:00–15:00 |
Asia/Shanghai |
| Asia-Pacific |
India, Sensex and NIFTY 50 |
09:00–15:00 |
Asia/Kolkata |
| Europe |
Belgium, BEL Small |
09:00–17:00 |
Europe/Brussels |
| Americas |
Mexico, S&P/BMV IPC |
08:00–15:00 |
America/Mexico_City |
| Americas |
Brazil, Ibovespa family |
10:00–17:00 |
America/Sao_Paulo |
Use the live Market open grouping when you want actionable context during the day. Use Timezone when planning the next research block. Daylight-saving rules differ, so IANA timezone labels are safer than a fixed conversion to your home clock.
How to hunt for opportunities after an index dip
The index is the alert. The opportunity, if one exists, usually sits one layer below it.
Step 1: demand a real signal
Start with a touched rolling low or a meaningful distance from the recent high. A one-day decline without a broader window is usually noise.
Step 2: look for confirmation without double-counting
Brazil has four indexes at six-month lows. That confirms country breadth, but it remains one Brazil thesis. Compare the broad benchmark, large-cap slice, and mid-cap slice to learn where weakness is concentrated.
Step 3: choose the investable route
Ask whether you can access:
- an ETF that closely tracks the country or index;
- a broader regional ETF with known exposure;
- the individual constituents on the local exchange.
Tracking error, currency, taxes, liquidity, and market hours can matter more than the headline index move.
Step 4: move from macro to fundamentals
For an ETF, inspect holdings, weights, concentration, fees, and liquidity. For individual companies, use a stock heat map to compare debt, leverage, profitability, valuation, and price reset against relevant peers. After a selloff, the Top Losers preset is a practical starting point.
Step 5: write down what would invalidate the idea
A dip thesis needs a failure condition. Examples include deteriorating earnings, refinancing stress, a currency shock, or a structural sector decline. If you cannot state what would prove the thesis wrong, the low is only an interesting chart.
What each regional signal means today
Europe: BEL Small is the strongest low signal
BEL Small is the only tracked index sitting directly at its 12-month low. Its neighboring BEL Mid index is about 4.1% above its own 12-month floor, which suggests the pressure is strongest lower in the market-cap range.
This deserves constituent-level work, not a blanket Belgium trade. Our detailed BEL Small opportunity analysis explains the 26-company universe, its sector mix, and the difference between a price plunge and financial quality.
Americas: Brazil has breadth, Mexico has freshness
Brazil offers the strongest confirmation cluster. IBRA, Ibovespa, IBrX 50, and MidLarge Cap all touched six-month lows, with one-month declines near 5%. The next question is whether the weakness comes from currency, rates, commodities, domestic earnings, or a mix.
Mexico offers the cleaner fresh dip. The S&P/BMV IPC touched a three-month low after falling 5.0% over three months. It deserves monitoring, but the shorter window makes it less mature than BEL Small or Brazil's six-month cluster.
Asia-Pacific: China is closest, India is a watch
The Shanghai Composite is 5.4% above its 12-month low and down 5.0% over three months. It has not triggered a rolling-low alert, so the disciplined action is to watch for confirmation rather than call a bottom.
Sensex and NIFTY 50 are farther from their lows and have positive three-month returns, despite weaker six-month figures. They provide useful regional contrast, but they are not the first dip-hunting targets today.
A five-minute Buydy workflow
Open global index monitoring, then:
- group by Continent → Country → Status;
- sort Touched first;
- switch to Session or Open first during market hours;
- shortlist one country signal per region;
- open the relevant ETF or constituent universe;
- use heat maps and filings to test whether the dip hides durable quality.
For a slower weekly version, use the global index monitoring routine and the weekly market research workflow.
Global indexes and global indices FAQ
Should I write “global indexes” or “global indices”?
Both are correct. Indexes is more common in US financial search language, so this article uses it as the primary term. Indices is common in international and institutional writing. They describe the same concept.
Which global index has the strongest dip signal now?
In Buydy's August 14, 2026 snapshot, BEL Small has the strongest duration signal because it touched a 12-month low. Brazil has the broadest country confirmation, while Mexico has a shorter three-month low.
Does hitting a low mean an index is undervalued?
No. A low identifies price weakness. Valuation requires earnings, cash flow, balance-sheet, currency, and constituent analysis.
How often should I check global indexes?
A brief daily session check and a deeper weekly review are usually enough for long-term research. More frequent checking can turn context into noise.
Data note
Figures use Buydy production index history through August 14, 2026. Returns are price changes in each index's local currency and exclude dividends. Rolling-low signals are generated from available closing history. Market sessions are simplified local working hours and do not account for every holiday or intraday break.
Research summary only; not investment advice.