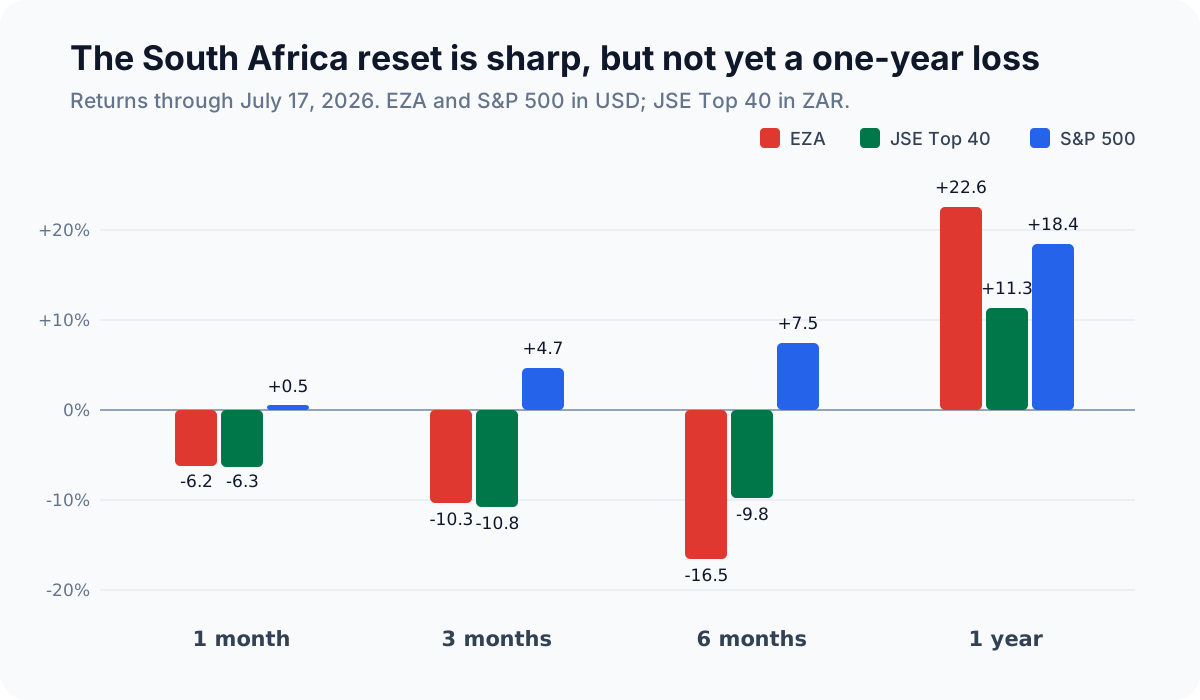
The iShares MSCI South Africa ETF (EZA) is beginning to look interesting after a sharp 2026 pullback, but the answer to “is EZA a buy?” is not a simple yes. Buydy production data through July 17, 2026 show EZA down 6.2% in one month, 10.3% in three months, and 16.5% in six months. It also sits about 21.9% below its 52-week high.
That decline has pushed the fund toward a more attractive valuation. The latest official iShares portfolio characteristics available in June showed a 12.93 P/E and 6.12% trailing distribution yield. Later market-data snapshots put the P/E closer to 11.9 and the trailing yield near 7.9%. The range is not a contradiction: holdings prices, earnings estimates, and EZA's unusually lumpy semiannual distributions move on different dates.
Our conclusion is:
EZA is a credible tactical value opportunity for a U.S. investor who can tolerate commodity, currency, and country concentration. It is not a core replacement for a diversified emerging-markets fund, and the opportunity can close quickly if metals recover or the rand strengthens.
This article goes deeper than the ETF headline. It compares the index downtrend, explains the macro drivers, maps all 27 equity holdings in a Buydy heat map, and finishes with three holdings that combine valuation with real operating strength.
The tax discussion is written specifically for U.S. taxable residents using U.S. brokerage accounts. Other investors face different fund access, withholding, and reporting rules.
EZA at a glance
EZA is a U.S.-domiciled, NYSE Arca-listed ETF that tracks the MSCI South Africa 25/50 Index. It gives a U.S. brokerage account one-trade exposure to South African large and mid-cap equities without requiring direct access to the Johannesburg Stock Exchange. Buydy's ETF screening workflow is designed to compare this kind of country fund with other ETFs before drilling into its holdings.
| EZA fact |
July 2026 snapshot |
Why it matters |
| Share price |
About $63 on July 16 |
Well below the $81.76 52-week high |
| Net assets |
About $542 million |
Tradable, but not a giant core-market ETF |
| Expense ratio |
0.59% |
Material cost for a long holding period |
| Equity holdings |
27 |
A concentrated single-country portfolio |
| Top 10 weight |
65.4% |
Company-specific outcomes matter |
| Materials weight |
About 36% |
Gold and PGM prices are major drivers |
| Financials weight |
About 35% |
Banks offset some mining concentration |
| P/E |
12.93 official June snapshot |
Cheaper than many developed-market indexes |
| Distribution yield |
6.12% official May snapshot |
Attractive, but distributions are variable |
| Distribution schedule |
Semiannual |
Income is not smooth month to month |
Sources for fund facts are the official iShares EZA page and the official July 16 holdings download.
How Buydy connects indexes, ETFs, and stock heat maps
This article follows Buydy's three-stage research funnel: establish the market regime, inspect the ETF wrapper, then compare the underlying companies.
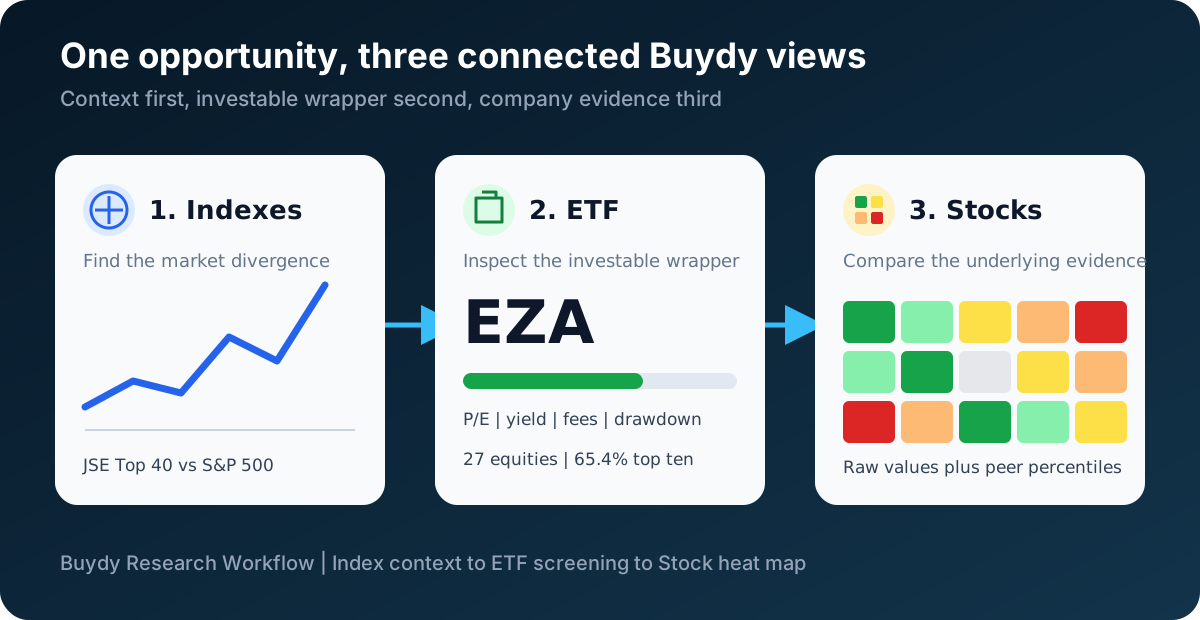
- Start with global index monitoring. The FTSE/JSE Top 40 shows whether South Africa is diverging from the S&P 500, NASDAQ, and European benchmarks.
- Narrow with ETF screening workflows. EZA converts local shares and rand movements into the return a U.S. brokerage account experiences, while exposing fees, yield, concentration, and drawdown.
- Verify with the Buydy stock heat map. The 27 holdings are compared using the same strict raw metrics and peer-percentile logic used across Buydy. This separates a weak country chart from genuinely weak companies.
The three views answer different questions. An index explains the market backdrop, the ETF explains the investable package, and the stock heat map shows where valuation and operating quality actually sit.
How far have South African stocks fallen?
The selloff is visible in both local and U.S. investor returns.
| Market |
1 month |
3 months |
6 months |
1 year |
| EZA, USD |
-6.2% |
-10.3% |
-16.5% |
+22.6% |
| FTSE/JSE Top 40, ZAR |
-6.3% |
-10.8% |
-9.8% |
+11.3% |
| S&P 500, USD |
+0.5% |
+4.7% |
+7.5% |
+18.4% |
| NASDAQ Composite, USD |
-1.9% |
+4.3% |
+8.5% |
+22.1% |
| DAX total return, EUR |
-0.4% |
+0.5% |
-1.8% |
+2.2% |
These are Buydy production index and ETF snapshots through July 17. Returns are in each instrument's quoted currency, so the JSE row is not a U.S. dollar return. EZA is the cleaner comparison for a U.S. investor because it includes the translation from rand assets into a dollar-traded ETF.
The important context is that EZA is falling from strength, not sitting at a multi-year depression. Its one-year return remains positive. The tactical question is whether the six-month reset has moved faster than the deterioration in underlying earnings.
Why is the South Africa ETF falling in 2026?
1. The mining rally reversed
Miners drove South African equities to records, then became the largest drag. During the second quarter, the JSE metals and mining sub-index fell about 24%, while the broad FTSE/JSE All Share Index fell roughly 3% to 4%. The mining sub-index represented more than a quarter of the benchmark, so the reversal had an outsized effect.
The laggards explain much of EZA's weakness. Gold Fields fell about 27% during the quarter, AngloGold about 19%, and Valterra Platinum about 20%, according to Bloomberg reporting carried by Moneyweb.
2. Gold, platinum, and palladium sold off together
On July 16 alone, spot gold fell nearly 2%, platinum about 3.1%, and palladium about 4.1%. Rising Treasury yields, a stronger dollar, and expectations that oil-driven inflation could keep U.S. rates higher all pressured non-yielding metals. CNBC's Reuters report documented gold's drop, while the broader metals move was reported across market data services.
This matters because four of EZA's top ten holdings are precious-metals miners: AngloGold, Gold Fields, Valterra Platinum, and Impala Platinum.
3. The rand added another layer of downside
EZA trades in dollars but owns mostly rand-listed shares. When the rand weakens, the same local share price translates into fewer dollars. Renewed Gulf and Middle East tensions pushed global investors toward the dollar and lifted oil prices. The rand traded near R16.35 per dollar on July 16.
The currency did not create the mining decline, but it amplified the return gap for a U.S. holder.
4. Higher oil prices hurt an energy importer
South Africa depends heavily on imported fuel. Brent moving above $85 raises the import bill, complicates inflation, and can delay rate relief. It also raises diesel, transport, and processing costs for energy-intensive mines. Stronger commodity export prices can offset part of that damage, but only when metals hold up.
5. Domestic mining output weakened
May mining production fell 5.4% year over year, the first contraction in six months. Iron ore output dropped 12.7%, coal 6.1%, and platinum-group metals 4.4%. The full picture is less bleak than the headline because mineral sales still rose 13.9%, supported by high PGM prices. Statistics South Africa data summarized by Trading Economics show the split between weaker physical output and stronger nominal sales.
What does EZA actually own?
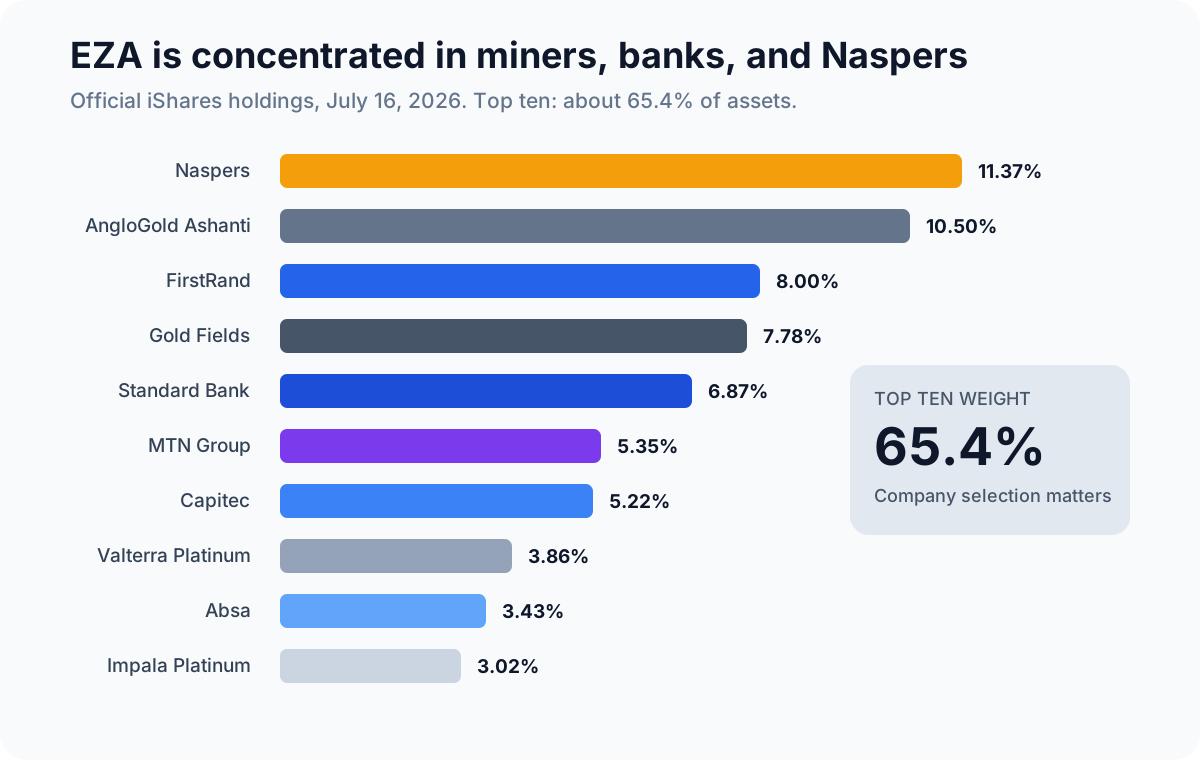
The July 16 iShares file contained 27 equities. The first ten represented about two-thirds of the fund.
| Company |
EZA weight |
Approx. P/E |
Buydy TTM yield |
Six-month price change |
Initial read |
| Naspers |
11.37% |
8.7x |
0.5% |
-17.9% |
Holding-company discount and Tencent exposure |
| AngloGold Ashanti |
10.50% |
11.2x |
6.3% |
-22.3% |
Strong cash flow, direct gold sensitivity |
| FirstRand |
8.00% |
12.5x |
7.4% |
+10.2% |
High-quality bank, UK redress overhang |
| Gold Fields |
7.78% |
8.2x |
3.2% |
-36.7% |
Strongest valuation and fundamentals mix |
| Standard Bank |
6.87% |
10.8x |
5.3% |
+11.8% |
Best non-commodity quality/value mix |
| MTN Group |
5.35% |
n/a |
3.6% |
+35.7% |
Strong momentum, less obvious reset |
| Capitec |
5.22% |
n/a |
1.5% |
+9.5% |
High-quality growth bank, richer valuation |
| Valterra Platinum |
3.86% |
n/a |
5.4% |
-34.0% |
Deep PGM cyclicality |
| Absa |
3.43% |
8.2x |
11.1% |
-9.9% |
Income and deep value, lower ROE |
| Impala Platinum |
3.02% |
n/a |
3.3% |
-48.4% |
Largest reset, also highest operating risk |
P/E approximations use the July 16 official holdings prices, the fund's ZAR/USD conversion rate, and trailing EPS from EODHD. Buydy yields and price changes are production values through July 17. “n/a” means we do not have a sufficiently reliable comparable P/E, not that the company has no earnings.
EZA full Buydy heat map: all 27 equities
The grid below applies Buydy's production metric engine to the full July 16 EZA equity book. Each cell is a percentile within these 27 holdings. Higher is better after inverting lower-is-better families such as debt, leverage, and P/E. Gray means insufficient or unusable data, and missing values are excluded from the average rather than treated as zero.
The heat map is a research map, not a buy ranking. Financial companies and miners have different balance-sheet economics, so compare the raw values and business model before acting on a color.
| Company | Rank | Dividend | Debt & net debt | Leverage | EBITDA & profitability | Price performance | P/E valuation | Intrinsic valuation | Valid |
|---|
| Sector | Ticker | Name | Cap | Avg | Dividend Yield… | 3M Dividend Yi… | 6M Dividend Yi… | 6M Dividend Gr… | 1Y Dividend Gr… | 3Y Dividend Gr… | 5Y Dividend Gr… | 10Y Dividend G… | D/E Ratio | D/E Change 3M | D/E Change 6M | D/E Change 1Y | D/E Change 2Y | Net Debt | Net Debt Chang… | Net Debt Chang… | Net Debt Chang… | Net Debt Chang… | Net Debt/EBITDA | Net Debt/EBITD… | Net Debt/EBITD… | Net Debt/EBITD… | Net Debt/EBITD… | EBITDA | EBITDA Growth 3M | EBITDA Growth 6M | EBITDA Growth 1Y | EBITDA Growth 2Y | Price Change 1W | Price Change 1M | Price Change 3M | Price Change 6M | Price Change 1Y | P/E (1M) | P/E (3M) | P/E (6M) | P/E (1Y) | DCF Upside % | Peter Lynch Up… | Valid |
|---|
| Basic Materials | ANG | AngloGold Ashanti Ltd (10.50% EZA) | $38.74B | 74% | 84% | 87% | 78% | 92% | 95% | 100% | 100% | 100% | 64% | 80% | 81% | 75% | 92% | 65% | 95% | 100% | 100% | 100% | 71% | 81% | 100% | 100% | 100% | 12% | 74% | 77% | 79% | 100% | 4% | 27% | 19% | 27% | 92% | 80% | 84% | 76% | 8% | 0% | 71% | 39/39 |
| Basic Materials | NPH | Northam Platinum Holdings Ltd (1.63% EZA) | $5.74B | 72% | 48% | 78% | 70% | 100% | 100% | 100% | n/a | n/a | 56% | 85% | 86% | 67% | 79% | 50% | 86% | 90% | 86% | 47% | 54% | 90% | 90% | 94% | 68% | 32% | 91% | 91% | 100% | 70% | 31% | 15% | 4% | 8% | 96% | 88% | 100% | 96% | 64% | 64% | 79% | 37/39 |
| Communication Services | VOD | Vodacom Group Ltd (1.95% EZA) | $15.60B | 69% | 56% | n/a | n/a | n/a | n/a | 36% | 14% | 0% | 96% | 100% | 100% | 100% | 100% | 92% | 100% | 100% | 100% | 100% | 79% | 100% | 100% | 100% | 100% | 88% | 48% | 45% | 25% | 30% | 96% | 100% | 92% | 77% | 46% | 0% | 8% | 24% | 48% | n/a | 38% | 34/39 |
| Financial Services | FSR | Firstrand Ltd (8.00% EZA) | $33.33B | 65% | 92% | 70% | 96% | n/a | 79% | 32% | 32% | 56% | 72% | 100% | 100% | 17% | 0% | 100% | 100% | 100% | 82% | 68% | 100% | 100% | 100% | 67% | 26% | 92% | 52% | 50% | 54% | 39% | 69% | 69% | 88% | 81% | 62% | 36% | 12% | 20% | 20% | n/a | 58% | 37/39 |
| Basic Materials | IMP | Impala Platinum Holdings Ltd (3.02% EZA) | $9.80B | 65% | 36% | 61% | 57% | 100% | n/a | n/a | 0% | n/a | 88% | 90% | 90% | 83% | 63% | 81% | 91% | 95% | 95% | 100% | 75% | 29% | 30% | 6% | 32% | 72% | 100% | 100% | 96% | 78% | 15% | 65% | 12% | 4% | 81% | 40% | 92% | 100% | 80% | 79% | 25% | 36/39 |
| Communication Services | MTN | MTN Group Ltd (5.35% EZA) | $26.12B | 63% | 40% | 57% | 52% | n/a | 63% | 77% | 68% | 25% | 20% | 60% | 62% | 79% | 67% | 8% | 77% | 81% | 73% | 63% | 38% | 86% | 85% | 89% | 79% | 100% | 96% | 95% | 88% | 83% | 85% | 81% | 100% | 96% | 85% | 24% | 0% | 4% | 4% | 71% | 17% | 38/39 |
| Financial Services | NED | Nedbank Group Ltd (2.37% EZA) | $7.60B | 63% | 0% | n/a | n/a | n/a | n/a | 55% | 91% | 81% | 52% | 100% | 48% | 92% | 58% | 77% | 100% | 100% | 100% | 100% | 83% | 100% | 100% | 100% | 100% | 48% | 13% | 9% | 13% | 9% | 65% | 58% | 73% | 50% | 27% | 48% | 32% | 56% | 56% | n/a | 33% | 34/39 |
| Basic Materials | GFI | Gold Fields Ltd (7.78% EZA) | $28.87B | 57% | 32% | 43% | 35% | 50% | 89% | 91% | 86% | 100% | 48% | 45% | 43% | 88% | 17% | 54% | 36% | 38% | 68% | 11% | 50% | 76% | 80% | 78% | 74% | 24% | 83% | 82% | 83% | 87% | 0% | 38% | 8% | 15% | 65% | 68% | 96% | 88% | 32% | 7% | 96% | 39/39 |
| Basic Materials | VAL | Valterra Platinum Limited (3.86% EZA) | $12.34B | 57% | 72% | n/a | n/a | n/a | n/a | 68% | 5% | 44% | 100% | 55% | 57% | n/a | 46% | 96% | 59% | 71% | n/a | 58% | n/a | n/a | n/a | n/a | n/a | n/a | n/a | n/a | n/a | n/a | 38% | 23% | 15% | 19% | 88% | 84% | 88% | 84% | 28% | n/a | n/a | 21/39 |
| Financial Services | SLM | Sanlam Ltd (2.98% EZA) | $11.29B | 56% | 76% | 100% | 100% | n/a | 16% | 59% | 59% | 88% | 76% | 40% | 38% | 58% | 29% | 85% | 50% | 52% | 77% | 95% | 92% | 62% | 65% | 61% | 63% | 60% | 17% | 14% | 17% | 22% | 35% | 62% | 62% | 46% | 19% | 44% | 44% | 60% | 72% | n/a | 63% | 37/39 |
| Financial Services | REM | Remgro Ltd (1.94% EZA) | $6.48B | 55% | 28% | 22% | 17% | 33% | 32% | 41% | 50% | 6% | 84% | 25% | 24% | 25% | 88% | 73% | 82% | 86% | 91% | 100% | 96% | 33% | 35% | 100% | 100% | 16% | 100% | 100% | 8% | 48% | 46% | 54% | 50% | 58% | 50% | 52% | 56% | 48% | 52% | 29% | 100% | 39/39 |
| Financial Services | CPI | Capitec Bank Holdings Ltd (5.22% EZA) | $33.43B | 52% | 20% | 17% | 39% | n/a | 26% | 82% | 82% | 100% | 80% | 95% | 95% | 0% | 83% | 88% | 18% | 19% | 64% | 74% | 88% | 19% | 20% | 28% | 16% | 64% | 61% | 59% | 67% | 65% | 50% | 73% | 85% | 73% | 58% | 32% | 16% | 28% | 16% | n/a | 8% | 37/39 |
| Financial Services | DSY | Discovery Holdings Ltd (2.73% EZA) | $10.50B | 51% | 12% | 13% | 13% | n/a | 11% | 86% | n/a | 13% | 60% | 75% | 76% | 71% | 75% | 62% | 23% | 24% | 100% | 100% | 63% | 24% | 25% | 100% | 100% | 52% | 65% | 64% | 63% | 4% | 23% | 4% | 54% | 85% | 54% | 96% | 52% | 16% | 44% | n/a | 46% | 36/39 |
| Basic Materials | SSW | Sibanye Stillwater Ltd (1.82% EZA) | $9.17B | 48% | 52% | 96% | 91% | n/a | n/a | n/a | 9% | n/a | 8% | 15% | 14% | 8% | 8% | 27% | 32% | 33% | 45% | 16% | 42% | 95% | 95% | 83% | 84% | 80% | 100% | 100% | 92% | 91% | 8% | 8% | 0% | 0% | 77% | n/a | n/a | n/a | n/a | 93% | 0% | 31/39 |
| Financial Services | OUT | OUTSURANCE GROUP LTD (1.54% EZA) | $7.81B | 48% | 24% | 48% | 43% | n/a | 5% | 45% | 95% | 75% | 92% | 0% | 0% | 96% | 96% | 69% | 41% | 43% | 36% | 100% | 67% | 52% | 55% | 22% | 89% | 28% | 9% | 5% | 50% | 52% | 81% | 96% | 96% | 92% | 15% | 8% | 4% | 8% | 60% | 14% | 13% | 38/39 |
| Industrials | BVT | Bidvest Group Ltd (1.59% EZA) | $4.89B | 47% | 80% | 52% | 48% | 83% | 42% | 14% | 23% | 50% | 16% | 70% | 71% | 42% | 54% | 19% | 68% | 67% | 32% | 26% | 13% | 67% | 70% | 39% | 21% | 40% | 57% | 55% | 38% | 17% | 73% | 50% | 65% | 54% | 35% | 56% | 40% | 52% | 76% | 21% | 50% | 39/39 |
| Real Estate | NRP | NEPI Rockcastle PLC (1.84% EZA) | $6.43B | 46% | 96% | 83% | 74% | 42% | 68% | 9% | 36% | 31% | 36% | 30% | 29% | 33% | 33% | 46% | 64% | 62% | 27% | 21% | 8% | 48% | 50% | 0% | 95% | 8% | 39% | 36% | 4% | 100% | 77% | 92% | 77% | 62% | 42% | 12% | 28% | 40% | 40% | n/a | 67% | 38/39 |
| Consumer Defensive | BID | Bid Corporation Ltd (2.80% EZA) | $8.92B | 45% | 4% | 0% | 0% | 58% | 74% | 18% | 45% | 69% | 44% | 65% | 67% | 50% | 50% | 31% | 55% | 57% | 59% | 42% | 33% | 43% | 45% | 56% | 37% | 36% | 35% | 32% | 46% | 35% | 92% | 85% | 81% | 69% | 12% | 20% | 24% | 32% | 88% | 43% | 29% | 39/39 |
| Basic Materials | SOL | Sasol Ltd (2.09% EZA) | $6.08B | 45% | 88% | 26% | 22% | 0% | 0% | 0% | n/a | n/a | 24% | 20% | 19% | 63% | 13% | 12% | 45% | 48% | 55% | 84% | 17% | 71% | 75% | 72% | 53% | 68% | 4% | 27% | 29% | 100% | 100% | 77% | 42% | 100% | 100% | 28% | 64% | 0% | 0% | 100% | 4% | 37/39 |
| Financial Services | ABG | Absa Group Ltd (3.43% EZA) | $10.93B | 43% | 100% | 91% | 83% | 75% | 84% | 27% | 27% | 38% | 0% | 0% | 0% | 29% | 38% | 0% | 5% | 5% | 41% | 79% | 4% | 10% | 10% | 44% | 47% | 76% | 43% | 41% | 33% | 26% | 62% | 0% | 35% | 42% | 73% | 100% | 72% | 64% | 24% | n/a | 92% | 38/39 |
| Consumer Cyclical | PPH | Pepkor Holdings Ltd (1.54% EZA) | $4.85B | 43% | 60% | 65% | 61% | n/a | 53% | 50% | 55% | n/a | 40% | 5% | 5% | 13% | 25% | 23% | 27% | 29% | 18% | 37% | 25% | 38% | 40% | 33% | 42% | 44% | 70% | 68% | 58% | 43% | 27% | 31% | 46% | 35% | 4% | 76% | 60% | 72% | 92% | 57% | 54% | 37/39 |
| Consumer Cyclical | SHP | Shoprite Holdings Ltd (2.61% EZA) | $9.30B | 41% | 44% | 30% | 26% | 25% | 37% | 5% | 18% | 19% | 4% | 50% | 52% | 54% | 21% | 15% | 73% | 76% | 50% | 32% | 21% | 57% | 60% | 50% | 58% | 56% | 26% | 23% | 21% | 61% | 58% | 35% | 58% | 65% | 38% | 72% | 48% | 36% | 68% | 36% | 21% | 39/39 |
| Healthcare | CLS | Clicks (1.10% EZA) | $3.16B | 38% | 64% | 35% | 87% | n/a | 47% | 73% | 73% | 94% | 32% | 10% | 10% | 21% | 42% | 42% | 0% | 0% | 14% | 53% | 46% | 0% | 0% | 11% | 11% | 20% | 22% | 18% | 42% | 0% | 88% | 42% | 23% | 23% | 0% | 64% | 80% | 80% | 100% | 50% | 42% | 38/39 |
| Financial Services | SBK | Standard Bank Group Ltd (6.87% EZA) | $31.98B | 37% | 68% | 74% | 65% | 67% | 21% | 23% | 41% | 63% | 12% | 0% | 0% | 4% | 4% | 4% | 0% | 0% | 9% | 0% | 29% | 5% | 5% | 17% | 5% | 96% | 78% | 73% | 71% | 57% | 42% | 46% | 69% | 88% | 69% | 60% | 36% | 12% | 12% | n/a | 75% | 38/39 |
| Basic Materials | HAR | Harmony Gold Mining Co. Ltd. (2.63% EZA) | $9.35B | 36% | 8% | 4% | 4% | 17% | n/a | n/a | n/a | n/a | 68% | 0% | 0% | 0% | 0% | 38% | 9% | 10% | 0% | 0% | 58% | 14% | 15% | 0% | 0% | 84% | 87% | 86% | 75% | 74% | 12% | 12% | 31% | 12% | 31% | 92% | 76% | 92% | 84% | 86% | 83% | 35/39 |
| Financial Services | RNI | Reinet Investments SCA (1.31% EZA) | $5.22B | 36% | 0% | 39% | 30% | 8% | 58% | 64% | 64% | 44% | 100% | 55% | 57% | 46% | 46% | 58% | 14% | 14% | 5% | 5% | n/a | n/a | n/a | n/a | n/a | 0% | 30% | n/a | 100% | 13% | 54% | 19% | 27% | 31% | 23% | 4% | 20% | 44% | 36% | n/a | n/a | 31/39 |
| Consumer Cyclical | NPN | Naspers Limited (11.37% EZA) | $40.21B | 34% | 16% | 9% | 9% | n/a | n/a | 95% | 77% | n/a | 28% | 35% | 33% | 38% | 71% | 35% | 0% | 0% | 23% | 89% | 0% | 0% | 0% | 0% | 0% | 4% | 0% | 0% | 0% | 96% | 19% | 88% | 38% | 38% | 8% | 16% | 68% | 68% | 96% | n/a | 88% | 35/39 |
39 metrics shown (2 dropped, valid for fewer than 10 of 27 names). Cells = display percentile vs EZA South Africa holdings peers (0–100). Avg = mean of valid percentiles in this table only; missing cells are excluded, not counted as zero. Hover for raw values. Debt, leverage, and P/E inverted so higher = better.
For percentiles and inverted metrics, read how to read a stock heat map. For the live UI, see how to use a stock heat map or the Buydy market heat map feature.
The six-company shortlist
The heat map and company filings narrow the 27 holdings to six serious candidates.
Gold Fields: strongest valuation plus fundamentals
Gold Fields combines an approximate 8.2x trailing P/E with a major price reset. Buydy shows the JSE shares down 31.0% in three months and 36.7% in six months, even though they remain up 40.2% over one year.
The operating numbers are unusually strong. Gold Fields reported $2.97 billion of adjusted free cash flow in 2025, up from $605 million, and company-reported net debt to adjusted EBITDA fell to 0.26x. Buydy's standardized latest-period calculation is 0.53x, still low. The company also adopted a base dividend tied to 35% of free cash flow before discretionary growth investment.
The risk is obvious: an 8x P/E can be a peak-earnings multiple when gold prices are elevated. A further gold decline can reduce both the earnings denominator and the valuation multiple at the same time.
Standard Bank: best non-commodity business
Standard Bank is the cleanest “normal business” in the shortlist. Its approximate P/E is 10.8x, and Buydy's trailing yield is 5.3%.
The bank reported 2025 return on equity of 19.3%, a 13.8% CET1 ratio, and 11% headline earnings growth. Management's 2026 to 2028 targets call for 8% to 12% annual headline EPS growth and 18% to 22% ROE. Those are high-quality returns at a value-like multiple. See the official Standard Bank financial highlights.
Unlike Gold Fields, Standard Bank has not suffered a deep six-month price collapse. It is here because quality remains reasonably priced, not because the chart is washed out.
Naspers: the discount and buyback case
Naspers is EZA's largest holding and the most unusual company in the fund. Its approximate P/E is 8.7x, while Buydy shows the shares down 17.9% over six months and 19.3% over one year.
Fiscal 2026 results included $1.5 billion of free cash flow and 24% growth in split-adjusted core headline EPS. The Naspers/Prosus structure continues to sell small portions of Tencent to fund open-ended buybacks. Since June 2022, the program returned close to $46 billion and reduced the combined holding-company discount by 16 percentage points, according to the company's FY2026 announcement.
The attraction is a large discount to net asset value. The risk is that this is not a simple operating-company P/E. Tencent, China risk, Prosus capital allocation, and the holding-company structure can keep the discount wide for years.
AngloGold Ashanti: excellent cash flow, duplicated commodity risk
AngloGold ranks near the top of the 27-name heat map. It generated $2.9 billion of free cash flow in 2025, ended the year with $879 million of adjusted net cash, and declared $1.8 billion of 2025 dividends. Its balance sheet is stronger than it was in the prior cycle.
It misses our top three because EZA already has heavy gold exposure, and Gold Fields currently offers the more dramatic price reset at a lower approximate P/E. Owning both raises the same macro bet.
FirstRand: high-quality bank with a specific overhang
FirstRand's ROE has been close to 20%, and its franchise quality is difficult to dispute. The approximate P/E is 12.5x, with a Buydy trailing yield of 7.4%.
The issue is the UK motor-finance redress scheme. FirstRand raised its provision to £750 million and plans to exit Aldermore. The group says its capital ratios remain above targets, but the provision is expected to reduce reported earnings and ROE. This is a finite issue if the provision is sufficient, but it prevents the stock from being a clean top-three pick today.
Absa: cheapest bank and strongest income setup
Absa is the deep-value bank. Its 2025 closing P/E was about 8.1x, return on equity improved to 15.0%, and CET1 reached 12.7%. Buydy's current trailing cash yield is 11.1%, which may differ from forward yield estimates because the metric uses paid dividends over the trailing window.
Absa deserves a lower multiple than Standard Bank because its ROE and operating efficiency are weaker. It is more attractive for income and re-rating potential, but Standard Bank remains our quality choice.
Top 3 EZA holdings to research now
| Rank |
Company |
Why it makes the top three |
Main risk |
| 1 |
Gold Fields (GFI) |
8.2x approximate P/E, 36.7% six-month decline, $2.97B adjusted FCF, low leverage |
Gold earnings may be near a cycle peak |
| 2 |
Standard Bank (SBK) |
10.8x P/E, 19.3% ROE, 13.8% CET1, credible medium-term targets |
South African credit and rate cycle |
| 3 |
Naspers (NPN) |
8.7x approximate P/E, 19.3% one-year decline, $1.5B FCF, buyback-supported NAV accretion |
Tencent, China, and holding-company discount |
This ranking deliberately selects three different return drivers: a gold miner, an African bank, and a global internet holding company. It avoids turning the shortlist into one large precious-metals position.
Is EZA suitable for a U.S. taxable account?
EZA is U.S.-domiciled, so a U.S. taxpayer generally receives standard broker reporting such as Form 1099-DIV. It is not the same as buying a non-U.S. pooled fund that may create PFIC reporting.
There are still tax details:
- South African withholding happens inside the investment chain. South Africa's statutory dividend withholding rate is 20%, although treaty treatment can reduce rates in qualifying cases.
- Foreign taxes may be reported by the fund. iShares publishes annual distribution tax information, including foreign-source income and foreign tax data used for Form 1116 calculations.
- Qualified-dividend treatment varies. Do not assume the displayed ETF yield receives one tax rate. Use the year-end 1099-DIV and iShares tax supplement.
- Taxable accounts can be more efficient than IRAs for recoverable foreign tax. A foreign tax credit may offset eligible passed-through foreign taxes in a taxable account. Taxes absorbed inside a retirement account generally cannot be reclaimed by the investor.
- This is not personal tax advice. Fund classification, qualified-dividend percentages, and foreign tax credits depend on the distribution year and your return.
The practical advantage is simplicity: EZA provides dollar trading and U.S. fund reporting while preserving targeted South Africa exposure.
Why this should be a limited opportunity, not a permanent core holding
EZA's cheapness can disappear in either direction.
If metals rebound and the rand strengthens, the ETF can recover quickly and the valuation discount can narrow before earnings improve. If gold and PGM prices continue falling, today's low P/E may prove to be based on peak profits. The same concentration that creates upside also makes the thesis fragile:
- The top ten holdings are 65.4% of assets.
- Materials and financials together represent roughly 71%.
- Four top-ten holdings depend directly on precious metals.
- One company, Naspers, adds a large Tencent and China factor.
- The rand can overwhelm local-currency stock gains for a U.S. holder.
- The 0.59% annual expense ratio compounds if the tactical position becomes permanent.
A sensible research framework is to treat EZA as a satellite allocation with explicit review triggers, not an automatic long-term core:
- Reassess if the fund returns to its 52-week high.
- Reassess if the P/E discount to emerging markets closes.
- Reassess if mining earnings estimates fall faster than prices.
- Reassess if oil remains elevated and the rand weakens further.
- Reassess after the next Gold Fields, Standard Bank, and Naspers results.
The opportunity is limited because the catalyst is a cyclical dislocation. Once the dislocation normalizes, the original reason to overweight South Africa weakens.
How to monitor the thesis in Buydy
Use global index monitoring to compare the FTSE/JSE Top 40 with U.S. and European benchmarks. Review EZA through the ETF screening workflow, then use the stock heat map to separate commodity weakness from company weakness.
The most useful signals are:
- EZA versus the JSE Top 40: divergence shows the rand effect.
- Gold Fields and AngloGold price change: confirms whether miners are stabilizing.
- Bank ROE and dividend updates: tests the non-commodity side of the fund.
- Debt and leverage percentiles: flags balance-sheet stress during the downturn.
- Missing metrics: keep them missing instead of replacing them with optimistic assumptions.
Every new Buydy account gets 12 months of full access free, with no credit card, for investors who want to build the same repeatable index, ETF, and stock review workflow.
EZA South Africa ETF FAQ
Is EZA a good ETF for investing in South Africa?
EZA is one of the most direct U.S.-listed ways to obtain large and mid-cap South Africa exposure. It is useful for a deliberate country allocation, but its 0.59% expense ratio, 65.4% top-ten concentration, and heavy materials and financials weights make it less suitable as a diversified core emerging-markets holding.
What are EZA's P/E ratio and dividend yield?
The official June 2026 iShares snapshot reported a 12.93 P/E, while later market snapshots moved closer to 11.9 as prices and earnings changed. The official trailing distribution yield was 6.12% at the end of May, while later trailing calculations approached 7.9%. Investors should compare values from the same date because EZA pays variable semiannual distributions.
Why did the EZA ETF fall in 2026?
The main drivers were a reversal in gold and platinum-group metals, falling South African mining shares, higher U.S. rate expectations, a stronger dollar, rand weakness, rising imported-energy costs, and weaker May mining production. EZA also fell from a strong prior-year base, so the six-month decline coexists with a positive one-year return.
Is EZA suitable for a U.S. taxable brokerage account?
EZA is U.S.-domiciled and generally uses standard U.S. broker tax reporting. Foreign taxes and the qualified-dividend percentage can vary by year, so investors should use their Form 1099-DIV and the annual iShares tax supplement. This article is general research, not individual tax advice.
Final answer: is EZA a buy?
EZA is becoming attractive, but only for an investor who wants a deliberate South Africa overweight. The ETF's six-month decline, roughly 12x earnings multiple, and 6% to 8% trailing distribution range create a legitimate value setup. The strongest evidence is not the headline P/E alone. It is the combination of a broad price reset and several holdings with excellent cash generation, capital strength, or a large asset-value discount.
Our preferred research order is:
- Gold Fields for the deepest fundamentals-backed reset.
- Standard Bank for quality at a reasonable valuation.
- Naspers for a differentiated discount and buyback thesis.
The bear case remains powerful: lower metals, higher oil, a weaker rand, and soft domestic output can all hit at once. That is why this is a limited tactical opportunity rather than a blanket call to buy the entire country indefinitely.
Sources and methodology
- iShares EZA official fund page, expense ratio and portfolio characteristics.
- iShares EZA official holdings CSV, holdings as of July 16, 2026.
- Moneyweb/Bloomberg: miners turn South African stocks from leaders to laggards, Q2 index and constituent performance.
- CNBC/Reuters: gold falls as Middle East tensions reinforce rate concerns, July 16 metals backdrop.
- Trading Economics: South Africa mining production, May 2026 production data.
- Gold Fields 2025 results filed with the SEC, free cash flow, leverage, and dividends.
- Standard Bank official FY2025 highlights, ROE, CET1, earnings, and payout.
- Absa FY2025 shareholder data, P/E, price-to-book, dividends, and market value.
- FirstRand UK motor commission update, provision and capital impact.
- AngloGold FY2025 results filed with the SEC, cash flow and net cash.
- Naspers/Prosus FY2026 results, Tencent stake, buybacks, and NAV accretion.
- Buydy production data, fetched July 18, 2026 UTC. ETF metrics and index closes run through July 17. Company fundamentals, dividends, prices, and 27-company percentiles use the same strict calculators and percentile engine as the Buydy production heat map.
Research summaries only; not investment advice. Not tax or legal advice. ETF holdings, prices, yields, tax character, and company fundamentals change.


