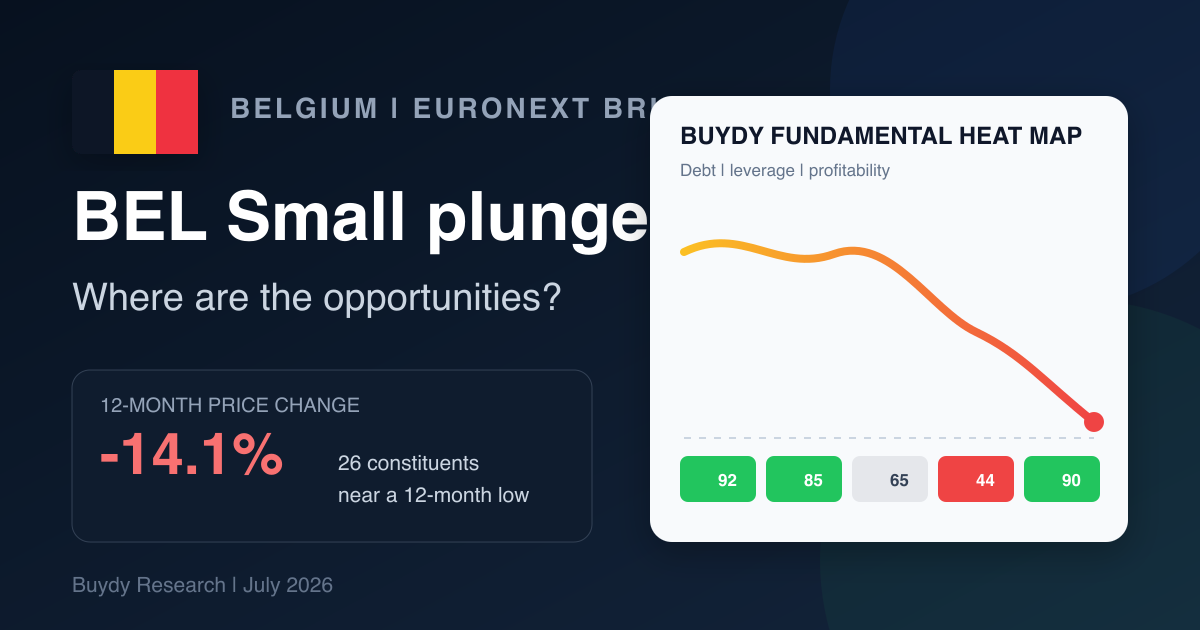
The BEL Small index fell 14.1% over the 12 months through July 10, 2026 while the BEL 20 rose 23.6% over the same window. That is a 37.7 percentage-point gap inside one country. Belgian small caps are near a 12-month low; Belgium's large-cap benchmark is not.
Why are Belgian small caps near a 12-month low while BEL 20 performed strongly? The weakness is concentrated in small-cap composition, financing sensitivity, and stock-specific selloffs, not a uniform crash across all Belgian equities. A falling price alone does not make a stock attractive. The research question is which constituents dragged the index, whether those problems are structural or temporary, and where Buydy's quantitative screen finds stronger fundamentals than the share-price move implies.
The short answer is selectivity. A weaker small-cap index can expose companies whose prices fell faster than operating foundations, but it can also contain leveraged businesses, deteriorating earnings, and illiquid shares. The opportunity is not "buy Belgium." It is to identify constituents with stronger debt, leverage, and profitability profiles, then investigate those companies individually.
BEL Small vs BEL 20 at a glance
According to Buydy's production index snapshot (closing data through July 10, 2026), the divergence looks like this:
| Index |
1 month |
3 months |
6 months |
12 months |
From 12-month high |
| BEL Small |
-2.3% |
-4.6% |
-8.5% |
-14.1% |
-16.6% |
| BEL 20 |
-0.1% |
+3.7% |
+9.4% |
+23.6% |
-3.8% |
| AEX |
+3.1% |
+8.1% |
+12.1% |
+17.8% |
0.0% |
| CAC 40 price index |
+2.2% |
+0.9% |
+1.8% |
+6.8% |
-3.3% |
These are price-index comparisons in local currencies and do not include dividends. They establish the scale of BEL Small's underperformance; they do not prove a single cause.
What is the BEL Small index?
The BEL Small is a Euronext-maintained equity index (ISIN BE0389857146) that tracks smaller companies listed on Euronext Brussels, below the BEL 20 and BEL Mid segments. Yahoo Finance quotes it as ^BELS for charting, but you cannot buy the index itself like a stock. Official membership and methodology are on the Euronext BEL Small index page.
As of this research snapshot, the index contains 26 companies. The book is concentrated: nine constituents are classified as real estate, six as industrials, four as healthcare, two as financial services, two as consumer defensive, and one each as basic materials, consumer cyclical, energy, and utilities.
Is there a BEL Small ETF? We are not aware of a widely available US-listed ETF or mutual fund that tracks BEL Small directly. Broader European small-cap funds may hold some Belgian names, but exposure is diluted.
BEL Small vs BEL 20: why the two indices diverged
BEL Small's decline does not necessarily mean investors are bearish on Belgium as a country. The two indices can move in opposite directions because they hold different companies.
| Factor |
BEL 20 (large caps) |
BEL Small |
| Business mix |
More multinationals with diversified revenue |
More domestic and European demand exposure |
| Sector tilt |
Heavier global industrials, brewers, holdings |
Heavy real estate, smaller industrials, healthcare |
| Financing |
Generally larger balance sheets, broader funding access |
More refinancing and rate sensitivity |
| Liquidity |
Deeper trading |
Thinner volumes; selloffs can overshoot fundamentals |
The 37.7-point 12-month gap is better read as a size, composition, and financing divide than as proof that Belgium's economy alone explains small-cap weakness.
What actually dragged BEL Small down?
BEL Small did not fall because every constituent declined. According to Buydy's analysis of all 26 members, several larger names rose over six months even while the index sat near its 12-month low. The drag came from weighted stock-specific selloffs, especially in consumer, healthcare, and select industrial names.
Because 12-month stock returns are incomplete in our production feed for many .BR tickers, the table below uses six-month price change and market-cap proxy weights (each company's cap divided by the sum of constituent caps on July 13, 2026). This is illustrative attribution, not Euronext's official index contribution math.
Estimated index drag ≈ proxy weight × 6M return (in percentage points).
| Company |
Est. weight |
6M return |
Est. 6M drag |
Sector |
Primary driver |
| Ontex Group |
2.1% |
-56.8% |
-1.17 pp |
Consumer defensive |
Steep consumer/company selloff |
| Bpost |
3.6% |
-25.2% |
-0.92 pp |
Industrials |
Restructuring and earnings pressure |
| Onward Medical |
2.0% |
-43.0% |
-0.86 pp |
Healthcare |
Pre-revenue medtech volatility |
| Hyloris |
1.5% |
-38.8% |
-0.58 pp |
Healthcare |
Development-stage biotech |
| Atenor |
1.1% |
-42.4% |
-0.48 pp |
Real estate |
Property/financing sensitivity |
| Immobel |
2.6% |
-10.6% |
-0.27 pp |
Real estate |
Mixed property exposure |
| Banque nationale de Belgique |
1.6% |
-15.2% |
-0.25 pp |
Financial services |
Idiosyncratic financial holding |
| Campine |
3.6% |
-5.8% |
-0.21 pp |
Industrials |
Modest industrial pullback |
| Biotalys |
1.6% |
-10.0% |
-0.16 pp |
Basic materials |
Smaller-cap ag-bio volatility |
| AGFA Gevaert |
0.7% |
-16.8% |
-0.12 pp |
Industrials |
Legacy imaging/industrial pressure |
Important distinction: Ontex is the largest estimated drag in this table, but it is not necessarily the "worst story" on fundamentals. A stock down 60% at 0.7% weight can matter less than a stock down 20% at 5% weight. Worst performer ≠ biggest index contributor.
Offsetting positive contributors over the same six-month window included EnergyVision (10.3% weight, +43.4%), Jensen-Group (8.6%, +37.9%), and CFE (~3.6%, +43.7%). That mix explains why the narrative is not "Belgian small caps uniformly collapsed."
Why are Belgian small caps underperforming?
No single data point proves causation, but four pressures fit the evidence:
- Financing and rate sensitivity. Nine of 26 constituents are real-estate companies. Property businesses and smaller issuers are particularly exposed to refinancing costs, credit availability, and valuation yields. CBRE's 2026 Belgium Investor Survey describes stabilising conditions, but also disciplined capital allocation rather than a broad risk-on market.
- Sector concentration, not uniform sector failure. Real estate and healthcare contain both major draggers (Atenor, Hyloris, Onward Medical) and six-month gainers (Nextensa, Home Invest Belgium, Vastned). Weakness is stock-specific within sectors, not a single-sector wipeout.
- Small-cap liquidity discount. Smaller shares have thinner trading volumes. When risk appetite falls, prices can move farther than liquid large caps, even without an equivalent change in reported fundamentals.
- Constituent-specific risk. The index mixes established cash generators with development-stage healthcare names, leveraged property companies, and businesses undergoing operating changes. That dispersion makes a blanket index conclusion unreliable.
Slow domestic growth adds context but does not fully explain the move. Belgium's expected 0.7% real GDP growth in 2026 (IMF via Worldometer; European Commission forecast) matters more to domestically exposed small companies than to diversified BEL 20 multinationals, but large-cap winners inside BEL Small's universe show GDP alone is not the whole story.
Does Belgium's economy explain the decline?
Belgium remains a wealthy, developed economy, but the 2026 backdrop is slow growth (about 0.7% real) and sticky inflation (about 3.4%), which can squeeze household purchasing power and domestic demand. The Federal Planning Bureau shows a broad institutional consensus around 0.6%–0.8% growth.
Use macro data to frame financing conditions and domestic demand, not to claim weak GDP mechanically caused a 14.1% index decline. The more useful chain is: slow growth → tighter financial conditions → pressure on leveraged small caps and domestic earners, while diversified large caps can still outperform.
How can investors get exposure to Belgian small caps?
Not through a BEL Small index product. There is no widely available US-listed ETF tracking this index. Practical routes:
- Individual constituents on Euronext Brussels, usually in euros, for investors whose brokers offer international access.
- OTC or alternate listings where they exist for specific names.
- Broader European small-cap ETFs, which may include some Belgian exposure but are not BEL Small proxies.
Liquidity, currency, withholding tax, and account rules vary by broker and ticker. Check access before trading. This article does not recommend a specific broker.
Where could the opportunity be?
The most interesting setup is a constituent with a depressed share price, positive operating earnings, manageable debt, and evidence that leverage is improving. The weakest setup is a company whose cheapness depends on refinancing, a turnaround, or future profitability that has not yet arrived.
Buydy identifies screening candidates, not guaranteed undervalued investments. A large price decline can mean mispricing or a value trap. The heat map helps separate the two questions.
This article uses the same Buydy heat map engine as the production dashboard, applied to all 26 BEL Small constituents so you can compare every name on the same footing.
What is the Buydy heat map?
A Buydy heat map is a peer-comparison grid. Each row is a company; each column is a metric. Cell color answers one question: how does this company rank against its peers on this metric?
In the live product, peer groups are usually sector or industry (every large-cap stock in the same GICS-style group). Here, the peer set is the 26 BEL Small constituents, because that is the investable universe US and international investors actually screen when they cannot buy the index as a fund.
For every cell Buydy stores two layers:
- Raw value: the output of a strict calculator (hover any cell in the table below).
- Percentile rank: where that raw value sits within the peer group (0–100 shown in the cell).
Color scale (display percentile):
| Score |
Color |
Meaning |
| 80–100 |
90% |
Top quintile within peers |
| 60–79 |
70% |
Above median |
| 40–59 |
50% |
Middle of the pack |
| 20–39 |
30% |
Below median |
| 0–19 |
10% |
Bottom quintile |
| n/a |
n/a |
Insufficient data, Buydy returns null instead of guessing |
Lower-is-better metrics are inverted for display. Debt, leverage, and P/E families flip the percentile so a higher score always means a stronger relative result (less debt, cheaper earnings). That matches the Buydy heat map UI and how to read a stock heat map.
Missing cells are intentional. If dividend history is too thin, EBITDA is negative, or valuation quality is not usable, the calculator or percentile job leaves the field empty. A dash is information, not a software bug.
Where the data comes from
| Layer |
Source |
What Buydy stores |
| Index levels |
Buydy production index snapshot |
BEL Small, BEL 20, AEX, CAC 40 closes through July 10, 2026 |
| Membership |
Euronext BEL Small composition |
26 tickers on Brussels (.BR) |
| Fundamentals |
EODHD fundamental API |
Quarterly/annual income, balance sheet, cash flow, highlights |
| Dividends |
EODHD dividend history |
Cash dividend dates and amounts (FX-normalised to USD where needed) |
| Prices |
EODHD end-of-day prices |
Weekly through 1-year price changes, P/E inputs |
| Sector labels |
EODHD fundamentals.General.Sector |
Used for grouping and context |
| Market cap |
EODHD Highlights.MarketCapitalization |
USD, July 2026 snapshot |
| Calculated metrics |
Buydy scanner jobs |
41 enabled calculators in metrics.json |
| Percentiles |
Buydy percentile engine |
Peer ranks with IQR outlier capping on change/growth metrics |
Third-party market data (EODHD, Euronext, macro sources) are distinct from Buydy's proprietary percentile and pick-score calculations.
How Buydy's ranking works (simplified)
According to Buydy's analysis of the full BEL Small universe:
- 37 metrics are shown in the heat map below (4 sparse fields dropped).
- Each cell is a display percentile versus the other 25 constituents, with debt/leverage/P/E inverted so higher is better.
- Outlier handling: growth and change metrics use IQR capping before ranking.
- Avg column: mean of valid display percentiles in the table; missing values are excluded, not treated as zero.
- Pick score (top three section): 55% fundamental quality (debt, leverage, EBITDA categories) + 45% price-reset score (deeper 3M/6M/9M/1Y declines rank higher after inversion).
Buydy returns null when inputs are insufficient rather than guessing. That is why many valuation and dividend-growth cells are blank.
Technical methodology (calculator rules, pipeline, and sparse-metric policy)
Pipeline on production (refreshed July 13, 2026 UTC): fundamentals → dividends → metrics → valuation (DCF and Peter Lynch) → price performance → percentiles. BEL Small names sit below Buydy's $1B large-cap gate, so they are maintained by a dedicated symbol pipeline.
Percentile (what colors show): For each metric, we rank raw values across the 26 BEL Small constituents using the same percentile module as production sector jobs, finite numbers only, IQR outlier capping on growth/change metrics, valuation quality gates (DCF/Lynch upside excluded when quality is N/A). Debt, leverage, and P/E percentiles are inverted for display so higher always means better.
Columns dropped from this table: Metrics with a valid percentile for fewer than 10 of 26 companies are hidden to reduce noise: 3M Dividend Growth (0/26), 6M Dividend Growth (0/26), Price Change 1Y (0/26), DCF Upside % (0/26).
Calculator rules (brief)
| Family |
How the raw value is built |
| Dividend yield |
Cash dividends in window ÷ latest price; FX-normalised where needed. |
| Dividend growth |
Rolling window vs prior window on dividend history; 3M/6M need payments in both windows, null for most annual payers. |
| Debt / equity |
Total debt ÷ total equity from merged quarterly balance sheet. |
| Net debt / EBITDA |
Net debt ÷ trailing EBITDA; null when EBITDA ≤ 0 or missing. |
| EBITDA growth |
Period-over-period % change on aligned quarters. |
| Price change |
EODHD adjusted close vs price N calendar days ago. |
| P/E |
Latest price ÷ EPS from fundamentals; null when EPS ≤ 0. |
| DCF / Lynch upside |
Strict models; often null for negative FCF or incomplete inputs. |
See the Buydy metric catalog for full definitions.
BEL Small full heat map: 26 companies × 37 metrics
Scroll horizontally. Identity columns and Avg stay fixed. Rows sorted by Avg (descending).
| Company | Rank | Dividend | Debt & net debt | Leverage | EBITDA & profitability | Price performance | P/E valuation | Intrinsic valuation | Valid |
|---|
| Sector | Ticker | Name | Cap | Avg | Dividend Yield… | 3M Dividend Yi… | 6M Dividend Yi… | 1Y Dividend Gr… | 3Y Dividend Gr… | 5Y Dividend Gr… | 10Y Dividend G… | D/E Ratio | D/E Change 3M | D/E Change 6M | D/E Change 1Y | D/E Change 2Y | Net Debt | Net Debt Chang… | Net Debt Chang… | Net Debt Chang… | Net Debt Chang… | Net Debt/EBITDA | Net Debt/EBITD… | Net Debt/EBITD… | Net Debt/EBITD… | Net Debt/EBITD… | EBITDA | EBITDA Growth 3M | EBITDA Growth 6M | EBITDA Growth 1Y | EBITDA Growth 2Y | Price Change 1W | Price Change 1M | Price Change 3M | Price Change 6M | P/E (TTM) | P/E (1M) | P/E (3M) | P/E (6M) | P/E (1Y) | Peter Lynch Up… | Valid |
|---|
| Industrials | CAMB | Campine | $318.0M | 72% | 28% | 12% | 12% | n/a | 100% | 100% | n/a | 85% | 100% | 95% | 95% | 89% | 67% | 100% | 100% | 100% | 100% | 63% | 100% | 100% | 100% | 100% | 67% | 28% | 16% | 65% | 74% | 24% | 4% | 57% | 39% | 87% | 93% | 60% | 85% | 93% | 93% | 35/37 |
| Real Estate | HOMI | Home Invest Belgium - Sifi | $379.2M | 71% | 61% | 59% | 59% | 92% | 91% | 79% | 88% | 100% | 100% | 100% | 100% | 100% | 71% | 100% | 100% | 100% | 100% | 71% | 100% | 100% | 100% | 100% | 38% | 6% | 32% | 15% | 4% | 52% | 13% | 67% | 78% | 80% | 87% | 47% | 15% | 60% | 53% | 37/37 |
| Healthcare | ONWD | Onward Medical N.V. | $174.5M | 64% | 0% | n/a | n/a | n/a | n/a | n/a | n/a | 75% | 90% | 86% | 81% | 95% | 100% | 100% | 100% | 95% | 100% | 88% | 100% | 100% | 39% | 100% | 8% | 78% | 68% | 30% | 17% | 10% | 22% | 14% | 4% | n/a | n/a | n/a | n/a | n/a | n/a | 25/37 |
| Real Estate | QRF | QRF SCA | $106.9M | 61% | 67% | 65% | 65% | 62% | 36% | 43% | n/a | 35% | 60% | 57% | 43% | 79% | 38% | 25% | 30% | 42% | 71% | 33% | 70% | 75% | 94% | 94% | 58% | 100% | 100% | 100% | 91% | 19% | 35% | 24% | 43% | 93% | 80% | 93% | 77% | 53% | 60% | 36/37 |
| Industrials | CFEB | Compagnie d Entreprises CFE SA | $311.5M | 60% | 39% | 29% | 29% | 77% | 73% | n/a | 13% | 55% | 85% | 81% | 90% | 84% | 96% | 100% | 100% | 100% | 100% | 100% | 100% | 100% | 100% | 100% | 33% | 17% | 5% | 10% | 13% | 29% | 100% | 95% | 100% | 67% | 7% | 7% | 0% | 13% | 27% | 36/37 |
| Consumer Cyclical | VAN | Van de Velde NV | $371.6M | 59% | 72% | 71% | 71% | n/a | 18% | 50% | 50% | 90% | 50% | 48% | 48% | 42% | 92% | 85% | 90% | 100% | 65% | 79% | 95% | 95% | 100% | 29% | 63% | 33% | 21% | 35% | 39% | 76% | 74% | 48% | 57% | 7% | 33% | 67% | 54% | 80% | 7% | 36/37 |
| Basic Materials | BTLS | Biotalys NV | $137.5M | 58% | 0% | n/a | n/a | n/a | n/a | n/a | n/a | 100% | 100% | 100% | 100% | 100% | 75% | 95% | 10% | 21% | 35% | 83% | 85% | 30% | 22% | 24% | 21% | 67% | 63% | 40% | 43% | 62% | 30% | 100% | 35% | n/a | n/a | n/a | n/a | n/a | n/a | 25/37 |
| Industrials | DECB | Deceuninck | $311.3M | 56% | 44% | 35% | 35% | 69% | 55% | 71% | 100% | 65% | 80% | 76% | 38% | 58% | 46% | 70% | 70% | 47% | 53% | 46% | 45% | 35% | 50% | 82% | 83% | 61% | 53% | 70% | 83% | 48% | 65% | 86% | 48% | 27% | 47% | 20% | 69% | 40% | 20% | 37/37 |
| Consumer Defensive | ONTEX | Ontex Group NV | $179.0M | 56% | 78% | 94% | 94% | 15% | 9% | n/a | n/a | 45% | 55% | 52% | 71% | 68% | 13% | 40% | 40% | 74% | 76% | 42% | 55% | 45% | 56% | 59% | 92% | 83% | 79% | 60% | 26% | 0% | 0% | 0% | 0% | 53% | 100% | 100% | 100% | 100% | 80% | 35/37 |
| Real Estate | WEHB | Wereldhav B-Sicafi | $603.7M | 55% | 89% | 82% | 82% | 85% | 64% | 21% | 38% | 60% | 20% | 24% | 5% | 26% | 25% | 20% | 20% | 16% | 47% | 29% | 65% | 70% | 44% | 71% | 79% | 100% | 100% | 90% | 65% | 81% | 91% | 43% | 61% | 47% | 20% | 73% | 46% | 47% | 73% | 37/37 |
| Real Estate | NEXTA | Nextensa NV | $475.0M | 52% | 17% | 24% | 24% | 8% | 0% | 7% | 0% | 40% | 70% | 67% | 76% | 74% | 8% | 80% | 80% | 89% | 88% | 13% | 60% | 60% | 78% | 76% | 75% | 94% | 95% | 75% | 61% | 95% | 70% | 76% | 83% | 20% | 40% | 33% | 8% | 27% | 47% | 37/37 |
| Consumer Defensive | COMB | Compagnie du Bois Sauvage SA | $485.7M | 51% | 11% | 18% | 18% | 31% | 27% | n/a | 63% | 70% | 25% | 33% | 24% | 11% | 50% | 45% | 45% | 63% | 24% | 58% | 75% | 80% | 72% | 47% | 88% | 100% | 100% | 85% | 57% | 57% | 52% | 29% | 65% | 40% | 60% | 87% | 38% | 20% | 67% | 36/37 |
| Real Estate | IMMO | Immobel | $225.0M | 51% | 83% | 41% | 41% | 46% | 0% | 14% | n/a | 15% | 75% | 71% | 86% | 63% | 4% | 75% | 75% | 79% | 82% | 0% | 10% | 5% | 0% | 41% | 46% | 22% | 11% | 95% | 96% | 33% | 100% | 81% | 30% | 100% | 0% | 27% | 92% | 87% | 100% | 36/37 |
| Real Estate | WEB | Warehouses Estates Belgium SCA | $140.1M | 51% | 50% | 76% | 76% | 23% | 18% | 86% | n/a | 25% | 65% | 62% | 57% | 32% | 33% | 50% | 50% | 53% | 59% | 17% | 50% | 40% | 61% | 88% | 42% | 39% | 58% | 45% | 35% | 81% | 78% | 62% | 70% | 73% | 27% | 53% | 31% | 33% | 33% | 36/37 |
| Utilities | ENRGY | EnergyVision NV | $903.1M | 50% | 0% | n/a | n/a | n/a | n/a | n/a | n/a | 100% | n/a | n/a | n/a | n/a | 79% | n/a | n/a | n/a | n/a | 92% | n/a | n/a | n/a | n/a | 29% | n/a | n/a | n/a | n/a | 90% | 96% | 90% | 96% | 0% | 13% | 13% | 0% | 7% | n/a | 14/37 |
| Energy | FLUX | Fluxys Belgium | $1.38B | 50% | 56% | 53% | 53% | 54% | 18% | 36% | 75% | 20% | 95% | 90% | 62% | 53% | 29% | 90% | 95% | 0% | 6% | 50% | 80% | 85% | 0% | 0% | 100% | 56% | 42% | 25% | 22% | 86% | 61% | 33% | 74% | 13% | 53% | 80% | 23% | 67% | 13% | 37/37 |
| Real Estate | ATEB | Atenor SA | $98.7M | 44% | 100% | 100% | 100% | 38% | 45% | 64% | n/a | 10% | 10% | 10% | 33% | 37% | 17% | 65% | 65% | 84% | 94% | 8% | 90% | 90% | 67% | 53% | 4% | 0% | 0% | 20% | 52% | 38% | 17% | 38% | 9% | n/a | n/a | n/a | n/a | n/a | 0% | 31/37 |
| Real Estate | VASTB | Vastned Retail Belgium | $472.4M | 42% | 33% | 47% | 47% | 0% | 0% | 29% | 25% | 50% | 40% | 19% | 10% | 5% | 21% | 35% | 25% | 0% | 0% | 4% | 35% | 25% | 83% | 18% | 54% | 67% | 47% | 100% | 87% | 71% | 48% | 71% | 52% | 60% | 67% | 40% | 62% | 73% | 87% | 37/37 |
| Healthcare | NYXH | Nyxoah | $151.7M | 41% | 0% | n/a | n/a | n/a | n/a | n/a | n/a | 100% | 35% | 38% | 52% | 47% | 88% | 10% | 85% | 37% | 41% | 75% | 25% | 55% | 28% | 12% | 0% | 44% | 74% | 55% | 9% | 0% | n/a | n/a | n/a | n/a | n/a | n/a | n/a | n/a | n/a | 22/37 |
| Industrials | BPOST | Bpost NV | $318.0M | 39% | 94% | 88% | 88% | n/a | n/a | 57% | n/a | 5% | 45% | 43% | 14% | 0% | 0% | 55% | 60% | 58% | 0% | 21% | 40% | 50% | 33% | 0% | 96% | 72% | 84% | 50% | 30% | 5% | 9% | 5% | 17% | n/a | n/a | n/a | n/a | n/a | 0% | 29/37 |
| Healthcare | SEQUA | Sequana Medical NV | $47.8M | 39% | 0% | n/a | n/a | n/a | n/a | n/a | n/a | 0% | 0% | 0% | 0% | 0% | 58% | 60% | 55% | 11% | 0% | 38% | 20% | 15% | 6% | 0% | 17% | 89% | 89% | 80% | 78% | 81% | 87% | 100% | 87% | n/a | n/a | n/a | n/a | n/a | n/a | 25/37 |
| Industrials | AGFB | AGFA Gevaert NV | $63.8M | 37% | 0% | n/a | n/a | n/a | n/a | n/a | n/a | 30% | 15% | 14% | 19% | 0% | 42% | 15% | 35% | 68% | 12% | 25% | 0% | 65% | 89% | 65% | 50% | 11% | 100% | 100% | 100% | 43% | 43% | 10% | 22% | n/a | n/a | n/a | n/a | n/a | 0% | 26/37 |
| Healthcare | HYL | Hyloris Developmentsen Sa | $130.2M | 37% | 0% | n/a | n/a | n/a | n/a | n/a | n/a | 95% | 30% | 29% | 29% | 16% | 83% | 30% | 15% | 26% | 29% | 96% | 30% | 20% | 17% | 35% | 25% | 67% | 26% | 0% | 70% | 100% | 57% | 0% | 13% | n/a | n/a | n/a | n/a | n/a | n/a | 25/37 |
| Industrials | JEN | Jensen-Group NV | $748.7M | 37% | 22% | 6% | 6% | 100% | 100% | 93% | 100% | 80% | 5% | 5% | 67% | 21% | 54% | 0% | 0% | 32% | 0% | 54% | 5% | 0% | 0% | 0% | 71% | 50% | 37% | 5% | 48% | 14% | 39% | 100% | 91% | 33% | 73% | 0% | 0% | 0% | 40% | 37/37 |
| Financial Services | QFG | Quest For Growth - Pricaf | $54.7M | 29% | 0% | n/a | n/a | n/a | n/a | n/a | n/a | 100% | 35% | 38% | 52% | 47% | 63% | 5% | 5% | 5% | 18% | 67% | 15% | 10% | 11% | 6% | 13% | 0% | 0% | 0% | 0% | 67% | 83% | 52% | n/a | n/a | n/a | n/a | n/a | n/a | n/a | 24/37 |
| Financial Services | BNB | Banque nationale de Belgique Société anonyme | $142.4M | 24% | 6% | 0% | 0% | n/a | 82% | 0% | n/a | n/a | n/a | n/a | n/a | n/a | n/a | n/a | n/a | n/a | n/a | n/a | n/a | n/a | n/a | n/a | n/a | n/a | n/a | n/a | n/a | 81% | 26% | 19% | 26% | n/a | n/a | n/a | n/a | n/a | 0% | 10/37 |
37 metrics shown (4 dropped, valid for fewer than 10 of 26 names). Cells = display percentile vs BEL Small peers (0–100). Avg = mean of valid percentiles in this table only; missing cells are excluded, not counted as zero. Hover for raw values. Debt, leverage, and P/E inverted so higher = better.
Which BEL Small stocks look interesting according to Buydy?
The wide heat map above is the authoritative peer view. This shortlist is a starting point for research, not a buy list. Rankings use live production MongoDB data for all 26 BEL Small constituents (as of 2026-07-13). We profile the top three composite picks after filters (including a ~$100M cap floor), not simply the three highest heat-map averages.
What we publish vs the full composite ranking: The model's composite top five was ONTEX, CAMB, QRF, AGFB, BPOST. This article profiles the top three only. AGFB ($64M cap) is dropped by a **$100M minimum market-cap bar** for the published shortlist (QRF at $107M is the smallest name we keep). BPOST ranked #5 and is not profiled here because we publish three weekly candidates, not five; its headline cap ($318M) is similar to Campine, so size is not the reason it is absent.
How the three were filtered
- Latest EBITDA must be positive (rules out pre-profit healthcare names).
- At least 20 valid display percentiles in the heat-map grid (of 37 shown metrics).
- Ranked by composite pick score (below), not fundamentals alone.
- Market cap at least ~$100M for the published shortlist (excludes AGFB).
- Top three composite scores after steps 1–4 (so BPOST at #5 stays in the heat map only).
Pick score formula (fundamentals + price reset)
We want patient, rules-based exposure: own better balance sheets and profitability after a meaningful price reset, not chase momentum.
| Component |
Weight |
What it measures |
| Fundamental score |
55% |
Mean of debt, leverage, and EBITDA category display percentiles within the 26-name BEL Small universe (same inversion rules as the heat map). |
| Price-cheap score |
45% |
How much the share has fallen vs peers across 3M, 6M, 9M, and 1Y price-change horizons. Each horizon uses Buydy’s stored price-change percentile, then inverts it (100 − performance percentile) so deeper plunges score higher. Missing horizons are skipped (not zeroed). 9M uses stored 6M when 1Y is absent (common in this index); when both 6M and 1Y exist, 9M is interpolated (40%×6M + 60%×1Y). Horizon weights: 3M 20%, 6M 25%, 9M 25%, 1Y 30%. |
Pick score = 55% × fundamental + 45% × price-cheap, rounded to an integer 0–100.
Fundamentals-only top five (a separate ranking with no plunge boost, not this three-name shortlist) would be: CAMB, QRF, HOMI, NEXTA, CFEB. Names like HOMI and CFEB rank highly on debt/EBITDA but drop on the composite list when recent price appreciation reduces their cheap score, by design.
How we use this list: Buydy is built for emotionless screening. These three ship as a weekly research add-on, not an all-in portfolio. Every ticker below links to Yahoo Finance for quick charts and news. Filings, liquidity, and your risk limits still decide whether anything belongs in a live position.
| Rank |
Company |
Cap |
Pick % |
Fund. % |
Price cheap % |
Price chg (raw) |
Debt avg % |
Leverage avg % |
EBITDA avg % |
Heatmap avg % |
| 1 |
Ontex Group NV (ONTEX.BR) |
$179.0M |
77% |
58% |
100% |
3M -29.5%, 6M -56.8%, 9M -56.8% |
53% |
51% |
68% |
56% |
| 2 |
Campine (CAMB.BR) |
$318.0M |
68% |
78% |
56% |
3M -0.7%, 6M -5.8%, 9M -5.8% |
93% |
93% |
50% |
72% |
| 3 |
QRF SCA (QRF.BR) |
$106.9M |
66% |
70% |
62% |
3M -6.3%, 6M -3.7%, 9M -3.7% |
48% |
73% |
90% |
61% |
Pick % = 55% fundamentals + 45% price-cheap score (display percentiles, 0–100). Tickers link to Yahoo Finance. *9M interpolated when 1Y is missing in DB.
Quality-at-price standouts: CAMB.BR, HOMI.BR, VAN.BR, strong fundamentals + cheap P/E vs BEL Small peers; less distressed than plunge-led names, better for patient buyers who want balance-sheet quality without betting on a collapse.
1. Ontex Group NV (ONTEX.BR), deep price plunge + acceptable fundamentals, Pick 77% (fund 58%, price cheap 100%)
Why it ranks first: The steepest price decline in the eligible set (3M -29.5%, 6M -56.8%, 9M -56.8%) with a middle-tier fundamental score (58/100). Buydy's composite deliberately boosts names that are cheap vs BEL Small peers while still clearing the EBITDA and data-quality bar. Ontex was also the largest estimated six-month index drag in our attribution table above.
Why the stock fell: A 56.8% six-month drawdown in a consumer defensive name usually reflects category pressure, earnings uncertainty, or company-specific news, not just index sentiment. Ontex is not a real-estate financing story; the selloff is idiosyncratic within BEL Small.
Why Buydy still flags it: Positive EBITDA ($88.4M), recent EBITDA growth percentiles in the upper half of peers, and a price-cheap score of 100 after the plunge. P/E near 11× looks inexpensive versus peers, though that can reflect lower-quality earnings as easily as mispricing.
Value-trap risks to verify: Net debt/EBITDA near 6.5× is only middle-of-the-pack inside BEL Small, but still meaningful if cash generation weakens. DCF is not usable (negative FCF). The ~13% yield must be checked against dividend coverage. If margins compress permanently, today's cheap P/E becomes a trap, not an opportunity.
| Theme |
vs other BEL Small names |
Honest read |
| Debt |
D/E 0.68× (53 debt avg). Net debt/EBITDA 6.53× (51 leverage avg). |
Middle of the pack on debt. |
| EBITDA |
EBITDA $88.4M. 1Y growth +9.7%, 3M +38.3% (68 EBITDA avg). |
Profitability percentiles lean positive; still verify whether recent moves are recurring. |
| Price / cheap |
Raw change: 3M -29.5%, 6M -56.8%, 9M -56.8%. Buydy price-cheap score 100 (higher = more pullback vs peers). Horizons: 3M, 6M, 9M*, 1Y when stored. |
Deep discount vs BEL Small, core reason for rank. |
| Dividends |
Yield ~13% (see heat map). 3M/6M growth mostly blank (annual payers). |
Income may matter, verify coverage. |
| DCF / valuation |
DCF not usable (neg fcf). Lynch upside +49.5%. P/E 11.05× (see heat map percentile). |
DCF is unreliable for much of this index; do not lean on a single model. |
What could prove the thesis wrong: Dividend cut, refinancing stress, or evidence that private-label/category pressure permanently lowered margins.
Buydy takeaway: Ontex is the clearest price-reset screen in this index today, not the cleanest balance sheet. Use Yahoo Finance and filings to decide whether the dip is mispricing or a value trap.
2. Campine (CAMB.BR), best balance sheet in the index, modest price dip, Pick 68% (fund 78%, price cheap 56%) Quality-at-price standout: strong fundamentals with cheap P/E vs peers.
Why it ranks second: Highest fundamental score in the shortlist (78), debt and de-leveraging percentiles lead the BEL 26. Price cheap score is only 56 (small 3M/6M declines), so it would rank #1 on fundamentals alone but yields the top slot to Ontex’s plunge.
| Theme |
vs other BEL Small names |
Honest read |
| Debt |
D/E 0.11× (93 debt avg). Net debt/EBITDA -0.09× (93 leverage avg). |
Balance sheet is a strength vs peers. |
| EBITDA |
EBITDA $25.5M. 1Y growth +13.4%, 3M -51.4% (50 EBITDA avg). |
EBITDA trend is mixed or weak, do not assume recovery. |
| Price / cheap |
Raw change: 3M -0.7%, 6M -5.8%, 9M -5.8%. Buydy price-cheap score 56 (higher = more pullback vs peers). Horizons: 3M, 6M, 9M*, 1Y when stored. |
Modest discount; fundamentals carry more weight. |
| Dividends |
Yield ~2.5% (see heat map). 3M/6M growth mostly blank (annual payers). |
Dividends are not the primary driver. |
| DCF / valuation |
DCF upside -48.1% (N/A quality). Lynch upside +1.7%. P/E 5.61× (see heat map percentile). |
DCF is unreliable for much of this index; do not lean on a single model. |
Buydy takeaway: Campine remains the quality anchor: low debt, cheap P/E, mixed near-term EBITDA trend. Not a high-confidence DCF story; rank here blends safety + slight discount, not a deep value plunge.
3. QRF SCA (QRF.BR), strong EBITDA screen, real-estate yield, moderate pullback, Pick 66% (fund 70%, price cheap 62%)
Why it ranks third: Balanced fundamental (70) and price-cheap (62) scores, EBITDA category average 90 is among the best in the index. Price has drifted lower (3M -6.3%, 6M -3.7%, 9M -3.7%) without Ontex-scale drawdown.
| Theme |
vs other BEL Small names |
Honest read |
| Debt |
D/E 0.77× (48 debt avg). Net debt/EBITDA 7.51× (73 leverage avg). |
Middle of the pack on debt. |
| EBITDA |
EBITDA $16.2M. 1Y growth +528.2%, 3M +271.5% (90 EBITDA avg). |
Profitability percentiles support the name. |
| Price / cheap |
Raw change: 3M -6.3%, 6M -3.7%, 9M -3.7%. Buydy price-cheap score 62 (higher = more pullback vs peers). Horizons: 3M, 6M, 9M*, 1Y when stored. |
Modest discount; fundamentals carry more weight. |
| Dividends |
Yield ~10.9% (see heat map). 3M/6M growth mostly blank (annual payers). |
Income may matter, verify coverage. |
| DCF / valuation |
DCF upside -59.6% (N/A quality). Lynch upside +33.9%. P/E 4.77× (see heat map percentile). |
DCF is unreliable for much of this index; do not lean on a single model. |
Buydy takeaway: QRF is the REIT-style compounder in the list: profitability percentiles are strong; debt is only average. Verify NAV, occupancy, and refinancing, not just heat-map greens.
Names that did not make the top three (and why)
- AGFA Gevaert (AGFB.BR) (~$64M): composite #4, deep price plunge, but below the ~$100M cap floor for this published shortlist.
- Bpost (BPOST.BR) (~$318M): composite #5, steep selloff and weak debt screen; not profiled because we publish three names, not five (headline cap is not the blocker).
- Home Invest Belgium (HOMI.BR): fundamentals-only #2 (Yahoo); composite #9 because price has not fallen enough (cheap score ~28), momentum works against the price-reset rule.
- CFE (CFEB.BR): strong leverage screen but positive 3M/6M price change; fails the plunge boost.
- Onward Medical (ONWD.BR): attractive cash/debt percentiles, but negative EBITDA (development-stage).
- EnergyVision (ENRGY.BR): only a handful of metrics gradeable; not comparable.
- National Bank of Belgium (BNB.BR): bank balance sheet; industrial debt/EBITDA formulas do not apply.
The tension across the shortlist is unchanged: plunge leaders often carry weaker debt or sparse data, and DCF rarely gives a clean upside in this index. A high pick score is a prompt to investigate, not permission to ignore red cells in the full heat map.
How to research the three candidates
Before treating any name as an opportunity, check:
- whether recent EBITDA strength is recurring or driven by one-off items;
- debt maturity dates, fixed-versus-floating exposure, and covenant headroom;
- free cash flow rather than EBITDA alone;
- share liquidity, bid-ask spread, and position sizing;
- management guidance and the next reporting catalyst;
- whether the price decline already reflects a permanent earnings reset.
This is where a stock heat map is most useful: it narrows a broad selloff into specific questions. Pair the table with a repeatable global index monitoring workflow, then open the company filings before making a decision.
The opportunity, and the risk
BEL Small's weakness is large enough to deserve attention. The index is near its 12-month low while Belgian and neighboring large-cap benchmarks remain far stronger. That divergence can create mispricing, especially where liquidity pressure overwhelms stable company fundamentals.
But the heat map does not show a uniformly cheap, high-quality market. It shows a mixed universe where strong debt grades often coexist with weak profitability, and where missing data must remain missing. The best opportunity is likely to come from patient, company-by-company underwriting rather than buying the decline indiscriminately.
What fell → who caused it → why they fell → which names merit deeper work. That is the arc this article is built around. Buydy's role is to narrow the screening universe after the decline, not to replace filing work or portfolio judgment.
Explore Buydy's market heat map, read how to use a stock heat map or how to read a stock heat map, or compare fund workflows with what is an ETF heat map and the live ETF heat map. See how to compare ETFs for mandate-first fund selection, or review pricing for the full research workspace.
BEL Small Index FAQ
What is the BEL Small Index?
The BEL Small Index is a Euronext-maintained benchmark of 26 smaller companies listed on Euronext Brussels, below the BEL 20 and BEL Mid segments. It is quoted as ^BELS on data platforms but is not directly investable as a single product.
Why is the BEL Small Index falling?
According to Buydy's index snapshot through July 10, 2026, BEL Small fell 14.1% over 12 months while BEL 20 rose 23.6%. The weakness reflects stock-specific selloffs (especially Ontex, Bpost, and several healthcare names), financing-sensitive sectors, and small-cap liquidity, not a uniform collapse of every Belgian company.
What companies are in the BEL Small Index?
The index contains 26 constituents across real estate, industrials, healthcare, financials, consumer, energy, and utilities. The full list and Buydy heat map are in this article; official membership is on Euronext.
How is BEL Small different from BEL 20?
BEL 20 holds Belgium's largest listed companies, often with more global revenue and deeper liquidity. BEL Small holds smaller issuers with heavier exposure to domestic demand, real estate, healthcare development names, and financing conditions.
Is there a BEL Small ETF?
We are not aware of a widely available US-listed ETF that tracks BEL Small directly. Investors usually access the theme through individual Brussels-listed stocks or diluted exposure via broader European small-cap funds.
Can US investors buy Belgian small-cap stocks?
Often yes, by ticker on Euronext Brussels or OTC equivalents, depending on broker international access, currency, and tax treatment. There is no standard US product for the index itself.
Are Belgian small-cap stocks undervalued?
Some may be; many are not. A lower index level creates a screening universe, not proof of value. Buydy's heat map ranks debt, leverage, profitability, and price reset within the 26 names, but filings and catalysts still decide whether a cheap stock is mispriced or a value trap.
Market hours and time zone
BEL Small constituents trade on Euronext Brussels (XBRU). Official session hours and holidays follow Brussels local time (CET / CEST). Buydy stores production prices and index snapshots in UTC; align your clock to the exchange calendar when comparing live quotes to our data. Session reference: TradingHours, Euronext Brussels.
Sources and methodology
- Euronext BEL Small official index page and composition, accessed July 12, 2026.
- Belgium GDP (2026), Worldometer, citing IMF World Economic Outlook data.
- European Commission economic forecast for Belgium.
- Belgian Federal Planning Bureau forecast comparison.
- CBRE Belgium Investor Survey 2026.
- Buydy production data, fetched July 13, 2026 UTC; index closes through July 10, 2026; constituent price changes and market-cap proxy weights for illustrative drag table through July 13, 2026. Percentiles and pick scores are Buydy proprietary calculations on EODHD fundamentals and prices.
- TradingHours, Euronext Brussels market hours, accessed July 13, 2026.
Research summary only; not investment advice. Index membership, prices, filings, and grades can change.